
 Yahoo Finance
 Is Gildan Activewear Inc.'s (TSE:GIL) CEO Pay Fair?

Glenn Chamandy became the CEO of Gildan Activewear Inc. (TSE:GIL) in 2004. This analysis aims first to contrast CEO compensation with other companies that have similar market capitalization. Then we'll look at a snap shot of the business growth. And finally - as a second measure of performance - we will look at the returns shareholders have received over the last few years. This method should give us information to assess how appropriately the company pays the CEO.
See our latest analysis for Gildan Activewear
How Does Glenn Chamandy's Compensation Compare With Similar Sized Companies?
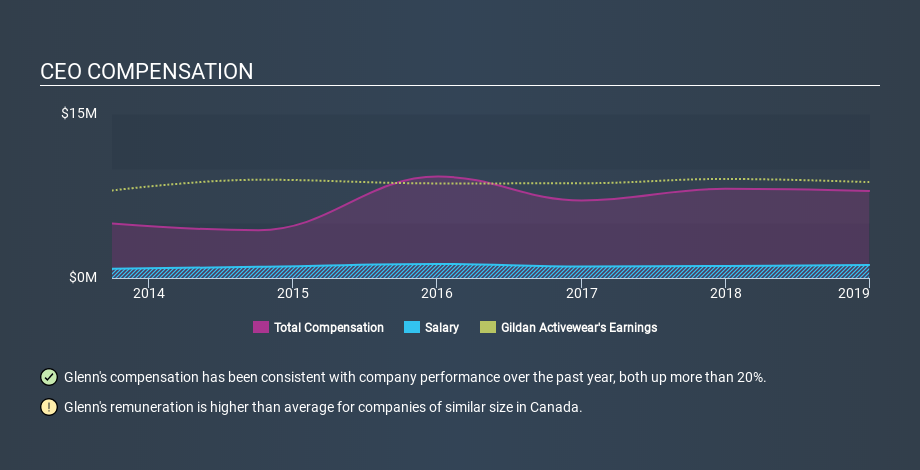
According to our data, Gildan Activewear Inc. has a market capitalization of CA$7.2b, and paid its CEO total annual compensation worth US$8.0m over the year to December 2018. While we always look at total compensation first, we note that the salary component is less, at US$1.2m. We further remind readers that the CEO may face performance requirements to receive the non-salary part of the total compensation. We examined companies with market caps from US$4.0b to US$12b, and discovered that the median CEO total compensation of that group was US$3.7m.
As you can see, Glenn Chamandy is paid more than the median CEO pay at companies of a similar size, in the same market. However, this does not necessarily mean Gildan Activewear Inc. is paying too much. We can better assess whether the pay is overly generous by looking into the underlying business performance.
You can see, below, how CEO compensation at Gildan Activewear has changed over time.
Is Gildan Activewear Inc. Growing?
Gildan Activewear Inc. has reduced its earnings per share by an average of 5.0% a year, over the last three years (measured with a line of best fit). Its revenue is down 2.9% over last year.
Unfortunately, earnings per share have trended lower over the last three years. And the fact that revenue is down year on year arguably paints an ugly picture. These factors suggest that the business performance wouldn't really justify a high pay packet for the CEO. Shareholders might be interested in this free visualization of analyst forecasts.
Has Gildan Activewear Inc. Been A Good Investment?
With a total shareholder return of 9.0% over three years, Gildan Activewear Inc. has done okay by shareholders. But they would probably prefer not to see CEO compensation far in excess of the median.
In Summary...
We examined the amount Gildan Activewear Inc. pays its CEO, and compared it to the amount paid by similar sized companies. Our data suggests that it pays above the median CEO pay within that group.
We think many shareholders would be underwhelmed with the business growth over the last three years. And shareholder returns are decent but not great. So we think more research is needed, but we don't think the CEO underpaid. CEO compensation is one thing, but it is also interesting to check if the CEO is buying or selling Gildan Activewear (free visualization of insider trades).
Arguably, business quality is much more important than CEO compensation levels. So check out this free list of interesting companies, that have HIGH return on equity and low debt.
If you spot an error that warrants correction, please contact the editor at editorial-team@simplywallst.com. This article by Simply Wall St is general in nature. It does not constitute a recommendation to buy or sell any stock, and does not take account of your objectives, or your financial situation. Simply Wall St has no position in the stocks mentioned.
We aim to bring you long-term focused research analysis driven by fundamental data. Note that our analysis may not factor in the latest price-sensitive company announcements or qualitative material. Thank you for reading.
