
 Yahoo Finance
 Is Gale Pacific Limited’s (ASX:GAP) CEO Paid Enough Relative To Peers?

Nick Pritchard has been the CEO of Gale Pacific Limited (ASX:GAP) since 2014. This analysis aims first to contrast CEO compensation with other companies that have similar market capitalization. After that, we will consider the growth in the business. And finally we will reflect on how common stockholders have fared in the last few years, as a secondary measure of performance. This process should give us an idea about how appropriately the CEO is paid.
See our latest analysis for Gale Pacific
How Does Nick Pritchard’s Compensation Compare With Similar Sized Companies?
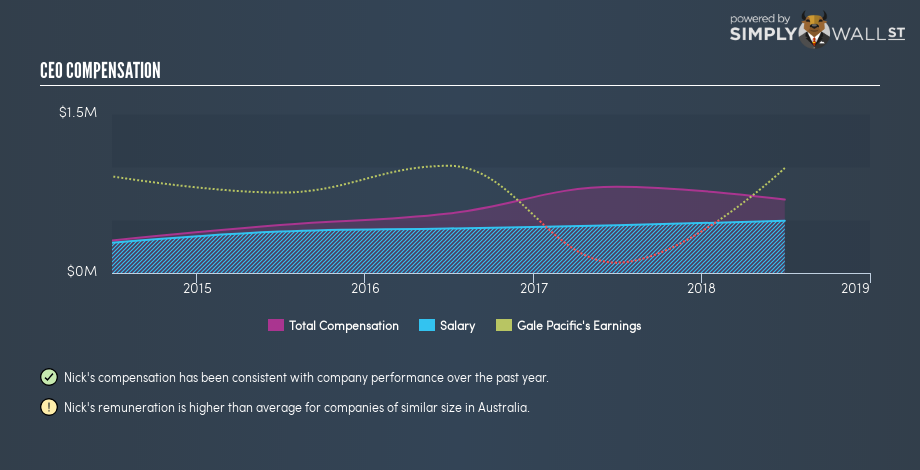
Our data indicates that Gale Pacific Limited is worth AU$103m, and total annual CEO compensation is AU$693k. (This number is for the twelve months until 2018). That’s actually a decrease on the year before. While this analysis focuses on total compensation, it’s worth noting the salary is lower, valued at AU$492k. We took a group of companies with market capitalizations below AU$277m, and calculated the median CEO compensation to be AU$364k.
As you can see, Nick Pritchard is paid more than the median CEO pay at companies of a similar size, in the same market. However, this does not necessarily mean Gale Pacific Limited is paying too much. A closer look at the performance of the underlying business will give us a better idea about whether the pay is particularly generous.
The graphic below shows how CEO compensation at Gale Pacific has changed from year to year.
Is Gale Pacific Limited Growing?
On average over the last three years, Gale Pacific Limited has shrunk earnings per share by 52% each year. Its revenue is down -8.3% over last year.
Sadly for shareholders, earnings per share are actually down, over three years. And the fact that revenue is down year on year arguably paints an ugly picture. These factors suggest that the business performance wouldn’t really justify a high pay packet for the CEO.
You might want to check this free visual report on analyst forecasts for future earnings.
Has Gale Pacific Limited Been A Good Investment?
Most shareholders would probably be pleased with Gale Pacific Limited for providing a total return of 43% over three years. As a result, some may believe the CEO should be paid more than is normal for companies of similar size.
In Summary…
We examined the amount Gale Pacific Limited pays its CEO, and compared it to the amount paid by similar sized companies. As discussed above, we discovered that the company pays more than the median of that group.
Earnings per share have not grown in three years, and the revenue growth fails to impress us.
But clearly there are some positives, because investors have done well over the same time frame. Considering this, shareholders are probably not too worried about the CEO compensation. Shareholders may want to check for free if Gale Pacific insiders are buying or selling shares.
Or you might prefer this data-rich interactive visualization of historic revenue and earnings.
To help readers see past the short term volatility of the financial market, we aim to bring you a long-term focused research analysis purely driven by fundamental data. Note that our analysis does not factor in the latest price-sensitive company announcements.
The author is an independent contributor and at the time of publication had no position in the stocks mentioned. For errors that warrant correction please contact the editor at editorial-team@simplywallst.com.
