
 Yahoo Finance
 Further weakness as Manchester United (NYSE:MANU) drops 3.4% this week, taking three-year losses to 29%
In order to justify the effort of selecting individual stocks, it's worth striving to beat the returns from a market index fund. But if you try your hand at stock picking, your risk returning less than the market. We regret to report that long term Manchester United plc (NYSE:MANU) shareholders have had that experience, with the share price dropping 31% in three years, versus a market return of about 52%.
Since Manchester United has shed UK£73m from its value in the past 7 days, let's see if the longer term decline has been driven by the business' economics.
View our latest analysis for Manchester United
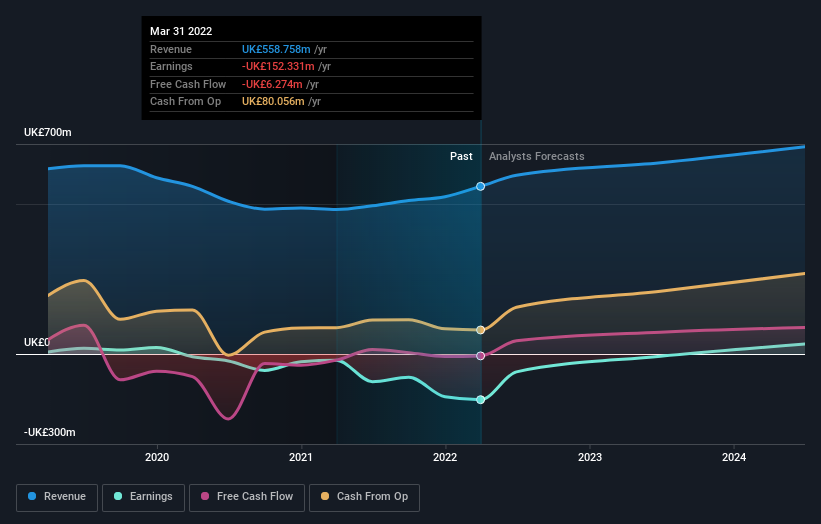
Because Manchester United made a loss in the last twelve months, we think the market is probably more focussed on revenue and revenue growth, at least for now. When a company doesn't make profits, we'd generally expect to see good revenue growth. That's because fast revenue growth can be easily extrapolated to forecast profits, often of considerable size.
Over the last three years, Manchester United's revenue dropped 7.2% per year. That is not a good result. The stock has disappointed holders over the last three years, falling 9%, annualized. That makes sense given the lack of either profits or revenue growth. However, in this kind of situation you can sometimes find opportunity, where sentiment is negative but the company is actually making good progress.
The graphic below depicts how earnings and revenue have changed over time (unveil the exact values by clicking on the image).
You can see how its balance sheet has strengthened (or weakened) over time in this free interactive graphic.
A Different Perspective
While the broader market lost about 10% in the twelve months, Manchester United shareholders did even worse, losing 18% (even including dividends). However, it could simply be that the share price has been impacted by broader market jitters. It might be worth keeping an eye on the fundamentals, in case there's a good opportunity. Regrettably, last year's performance caps off a bad run, with the shareholders facing a total loss of 4% per year over five years. Generally speaking long term share price weakness can be a bad sign, though contrarian investors might want to research the stock in hope of a turnaround. Before spending more time on Manchester United it might be wise to click here to see if insiders have been buying or selling shares.
For those who like to find winning investments this free list of growing companies with recent insider purchasing, could be just the ticket.
Please note, the market returns quoted in this article reflect the market weighted average returns of stocks that currently trade on US exchanges.
Have feedback on this article? Concerned about the content? Get in touch with us directly. Alternatively, email editorial-team (at) simplywallst.com.
This article by Simply Wall St is general in nature. We provide commentary based on historical data and analyst forecasts only using an unbiased methodology and our articles are not intended to be financial advice. It does not constitute a recommendation to buy or sell any stock, and does not take account of your objectives, or your financial situation. We aim to bring you long-term focused analysis driven by fundamental data. Note that our analysis may not factor in the latest price-sensitive company announcements or qualitative material. Simply Wall St has no position in any stocks mentioned.
