
 Yahoo Finance
 Further weakness as FingerMotion (NASDAQ:FNGR) drops 10% this week, taking one-year losses to 81%
As every investor would know, you don't hit a homerun every time you swing. But serious investors should think long and hard about avoiding extreme losses. It must have been painful to be a FingerMotion, Inc. (NASDAQ:FNGR) shareholder over the last year, since the stock price plummeted 81% in that time. That'd be enough to make even the strongest stomachs churn. To make matters worse, the returns over three years have also been really disappointing (the share price is 64% lower than three years ago). Shareholders have had an even rougher run lately, with the share price down 48% in the last 90 days. This could be related to the recent financial results - you can catch up on the most recent data by reading our company report. We really feel for shareholders in this scenario. It's a good reminder of the importance of diversification, and it's worth keeping in mind there's more to life than money, anyway.
With the stock having lost 10% in the past week, it's worth taking a look at business performance and seeing if there's any red flags.
Check out our latest analysis for FingerMotion
Because FingerMotion made a loss in the last twelve months, we think the market is probably more focussed on revenue and revenue growth, at least for now. When a company doesn't make profits, we'd generally expect to see good revenue growth. As you can imagine, fast revenue growth, when maintained, often leads to fast profit growth.
FingerMotion grew its revenue by 37% over the last year. That's definitely a respectable growth rate. Unfortunately, the market wanted something better, given it sent the share price 81% lower during the year. It could be that the losses are too much for investors to handle without losing their nerve. We'd posit that the future looks challenging, given the disconnect between revenue growth and the share price.
The image below shows how earnings and revenue have tracked over time (if you click on the image you can see greater detail).
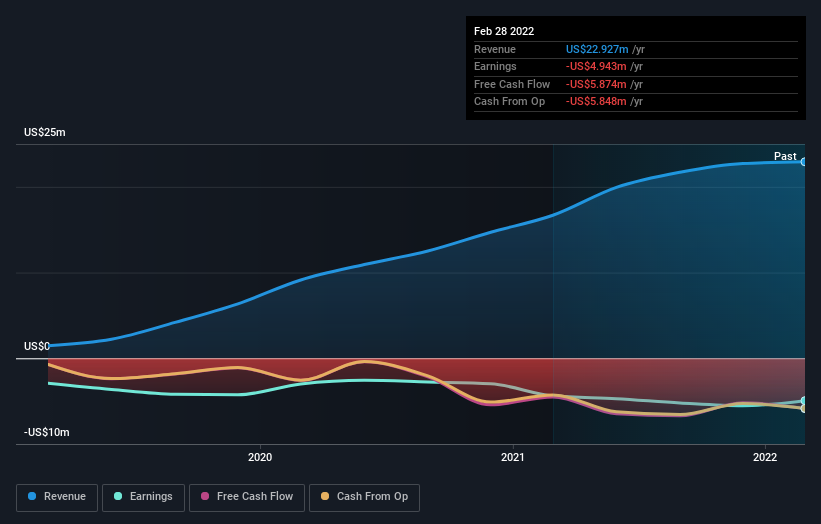
It's probably worth noting that the CEO is paid less than the median at similar sized companies. It's always worth keeping an eye on CEO pay, but a more important question is whether the company will grow earnings throughout the years. This free interactive report on FingerMotion's earnings, revenue and cash flow is a great place to start, if you want to investigate the stock further.
A Different Perspective
The last twelve months weren't great for FingerMotion shares, which performed worse than the market, costing holders 81%. The market shed around 11%, no doubt weighing on the stock price. Shareholders have lost 18% per year over the last three years, so the share price drop has become steeper, over the last year; a potential symptom of as yet unsolved challenges. Although Baron Rothschild famously said to "buy when there's blood in the streets, even if the blood is your own", he also focusses on high quality stocks with solid prospects. I find it very interesting to look at share price over the long term as a proxy for business performance. But to truly gain insight, we need to consider other information, too. Take risks, for example - FingerMotion has 4 warning signs (and 1 which shouldn't be ignored) we think you should know about.
Of course FingerMotion may not be the best stock to buy. So you may wish to see this free collection of growth stocks.
Please note, the market returns quoted in this article reflect the market weighted average returns of stocks that currently trade on US exchanges.
Have feedback on this article? Concerned about the content? Get in touch with us directly. Alternatively, email editorial-team (at) simplywallst.com.
This article by Simply Wall St is general in nature. We provide commentary based on historical data and analyst forecasts only using an unbiased methodology and our articles are not intended to be financial advice. It does not constitute a recommendation to buy or sell any stock, and does not take account of your objectives, or your financial situation. We aim to bring you long-term focused analysis driven by fundamental data. Note that our analysis may not factor in the latest price-sensitive company announcements or qualitative material. Simply Wall St has no position in any stocks mentioned.
