
 Yahoo Finance
 Is frontdoor, inc.’s (NASDAQ:FTDR) 32% ROCE Any Good?

Today we'll evaluate frontdoor, inc. (NASDAQ:FTDR) to determine whether it could have potential as an investment idea. To be precise, we'll consider its Return On Capital Employed (ROCE), as that will inform our view of the quality of the business.
First up, we'll look at what ROCE is and how we calculate it. Then we'll compare its ROCE to similar companies. And finally, we'll look at how its current liabilities are impacting its ROCE.
Return On Capital Employed (ROCE): What is it?
ROCE is a metric for evaluating how much pre-tax income (in percentage terms) a company earns on the capital invested in its business. All else being equal, a better business will have a higher ROCE. In brief, it is a useful tool, but it is not without drawbacks. Author Edwin Whiting says to be careful when comparing the ROCE of different businesses, since 'No two businesses are exactly alike.
So, How Do We Calculate ROCE?
Analysts use this formula to calculate return on capital employed:
Return on Capital Employed = Earnings Before Interest and Tax (EBIT) ÷ (Total Assets - Current Liabilities)
Or for frontdoor:
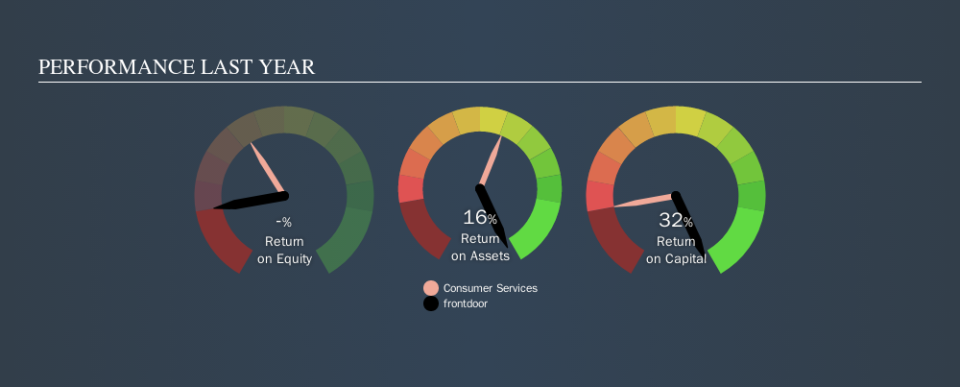
0.32 = US$247m ÷ (US$1.2b - US$396m) (Based on the trailing twelve months to June 2019.)
Therefore, frontdoor has an ROCE of 32%.
See our latest analysis for frontdoor
Does frontdoor Have A Good ROCE?
ROCE is commonly used for comparing the performance of similar businesses. frontdoor's ROCE appears to be substantially greater than the 9.4% average in the Consumer Services industry. We consider this a positive sign, because it suggests it uses capital more efficiently than similar companies. Putting aside its position relative to its industry for now, in absolute terms, frontdoor's ROCE is currently very good.
You can click on the image below to see (in greater detail) how frontdoor's past growth compares to other companies.
When considering ROCE, bear in mind that it reflects the past and does not necessarily predict the future. Companies in cyclical industries can be difficult to understand using ROCE, as returns typically look high during boom times, and low during busts. ROCE is only a point-in-time measure. What happens in the future is pretty important for investors, so we have prepared a free report on analyst forecasts for frontdoor.
frontdoor's Current Liabilities And Their Impact On Its ROCE
Current liabilities include invoices, such as supplier payments, short-term debt, or a tax bill, that need to be paid within 12 months. Due to the way the ROCE equation works, having large bills due in the near term can make it look as though a company has less capital employed, and thus a higher ROCE than usual. To check the impact of this, we calculate if a company has high current liabilities relative to its total assets.
frontdoor has total assets of US$1.2b and current liabilities of US$396m. Therefore its current liabilities are equivalent to approximately 34% of its total assets. A medium level of current liabilities boosts frontdoor's ROCE somewhat.
What We Can Learn From frontdoor's ROCE
Still, it has a high ROCE, and may be an interesting prospect for further research. frontdoor looks strong on this analysis, but there are plenty of other companies that could be a good opportunity . Here is a free list of companies growing earnings rapidly.
I will like frontdoor better if I see some big insider buys. While we wait, check out this free list of growing companies with considerable, recent, insider buying.
We aim to bring you long-term focused research analysis driven by fundamental data. Note that our analysis may not factor in the latest price-sensitive company announcements or qualitative material.
If you spot an error that warrants correction, please contact the editor at editorial-team@simplywallst.com. This article by Simply Wall St is general in nature. It does not constitute a recommendation to buy or sell any stock, and does not take account of your objectives, or your financial situation. Simply Wall St has no position in the stocks mentioned. Thank you for reading.
