
 Yahoo Finance
 Is Fortinet, Inc. (NASDAQ:FTNT) Overpaying Its CEO?

Ken Xie has been the CEO of Fortinet, Inc. (NASDAQ:FTNT) since 2000. This analysis aims first to contrast CEO compensation with other large companies. Then we'll look at a snap shot of the business growth. And finally we will reflect on how common stockholders have fared in the last few years, as a secondary measure of performance. This method should give us information to assess how appropriately the company pays the CEO.
Check out our latest analysis for Fortinet
How Does Ken Xie's Compensation Compare With Similar Sized Companies?
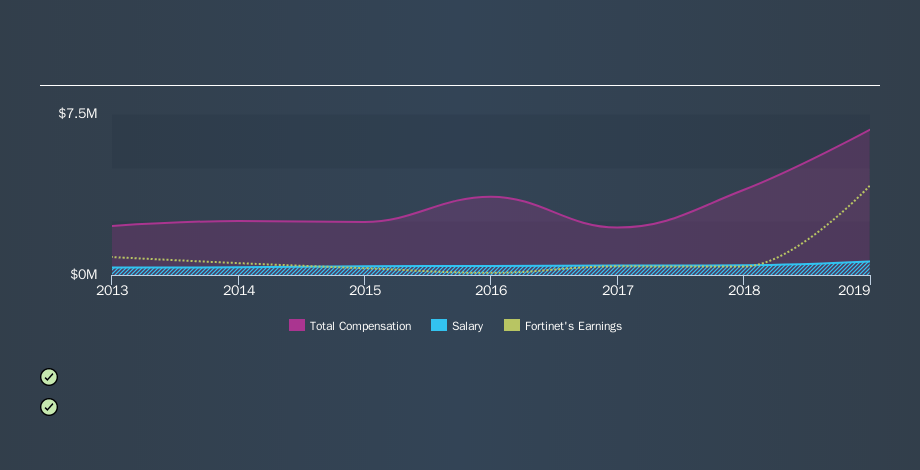
According to our data, Fortinet, Inc. has a market capitalization of US$17b, and paid its CEO total annual compensation worth US$6.8m over the year to December 2018. We think total compensation is more important but we note that the CEO salary is lower, at US$625k. Importantly, there may be performance hurdles relating to the non-salary component of the total compensation. When we examined a group of companies with market caps over US$8.0b, we found that their median CEO total compensation was US$11m. There aren't very many mega-cap companies, so we had to take a wide range to get a meaningful comparison figure.
A first glance this seems like a real positive for shareholders, since Ken Xie is paid less than the average total compensation paid by other large companies. However, before we heap on the praise, we should delve deeper to understand business performance.
You can see a visual representation of the CEO compensation at Fortinet, below.
Is Fortinet, Inc. Growing?
On average over the last three years, Fortinet, Inc. has grown earnings per share (EPS) by 90% each year (using a line of best fit). In the last year, its revenue is up 20%.
This demonstrates that the company has been improving recently. A good result. It's a real positive to see this sort of growth in a single year. That suggests a healthy and growing business. You might want to check this free visual report on analyst forecasts for future earnings.
Has Fortinet, Inc. Been A Good Investment?
I think that the total shareholder return of 215%, over three years, would leave most Fortinet, Inc. shareholders smiling. This strong performance might mean some shareholders don't mind if the CEO were to be paid more than is normal for a company of its size.
In Summary...
Fortinet, Inc. is currently paying its CEO below what is normal for large companies.
Many would consider this to indicate that the pay is modest since the business is growing. The pleasing shareholder returns are the cherry on top; you might even consider that Ken Xie deserves a raise! Most shareholders like to see a modestly paid CEO combined with strong performance by the company. It would be even more positive if company insiders are buying shares. Shareholders may want to check for free if Fortinet insiders are buying or selling shares.
Arguably, business quality is much more important than CEO compensation levels. So check out this free list of interesting companies, that have HIGH return on equity and low debt.
We aim to bring you long-term focused research analysis driven by fundamental data. Note that our analysis may not factor in the latest price-sensitive company announcements or qualitative material.
If you spot an error that warrants correction, please contact the editor at editorial-team@simplywallst.com. This article by Simply Wall St is general in nature. It does not constitute a recommendation to buy or sell any stock, and does not take account of your objectives, or your financial situation. Simply Wall St has no position in the stocks mentioned. Thank you for reading.
