
 Yahoo Finance
 Forex Daily Recap – USD Index was Underway to its Monthly Tops
US Dollar Index
Quite notably, the Greenback was forming a rising wedge pattern, pleasing the bears. Meanwhile, the USD Index continued to stay well above the red Ichimoku Clouds, aiming the 98.45 resistance handle. On the flip side, 97.16 stable support handle remained as an authoritative stoppage. The RSI stood muted near 55 level, maintaining a neutral perspective on future actions.
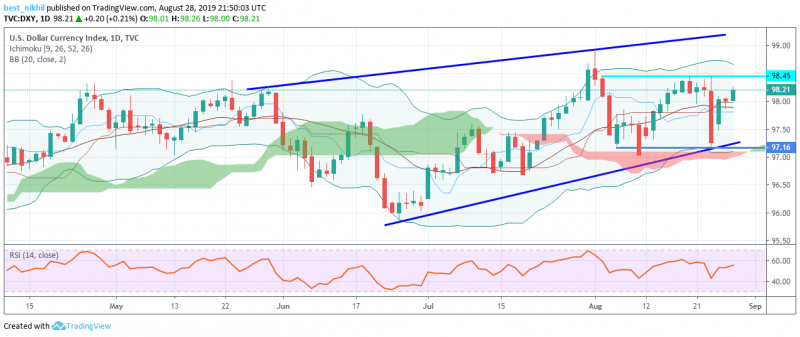
Later the day, after a speech in West Virginia, Federal Reserve Bank of Richmond President Thomas Barkin provided his economic outlook. Barkin said, “The national economy appears great. Unemployment is at 50-year lows, GDP growth is solid, and consumers feel confident and are spending,”. However, he added that the International economies were getting weaker and escalating trade tensions.” Nonetheless, the USD Index continued to believe over the bulls on Wednesday. In the middle of the day, the MBA Mortgage Applications computed since Aug 23, reported -6.2% over the previously recorded -0.9%.
AUD/USD
The Aussie pair continued to remain choppy throughout the day. Anyhow, the overall sentiment was bit leaning to the downside as the day was approaching the closing mark. Interim, overhead Parabolic SAR continued to maintain intense downward pressure on the pair’s daily price actions. Quite notably, the AUD/USD pair had attempted to make a move below the firm 0.6745 support handle. Any upside move would have immediately activated the above lying sturdy resistance cluster comprising of 50-day, 100-day, and 200-day SMAs.

On the event side, the Q2 Construction Work Done report came out at around 01:30 GMT, disappointing market participants. The Street analysts had expected Q2 Work report to record near -1.0% this time. However, the actual reports came around -3.8%, missing estimates.
EUR/USD
The Fiber was underway to close negative for the third consecutive day this week in order to justify the 2-month-old downtrend channel. Anyhow, a firm 1.1060 support level, was acting as a stoppage, preventing the downside.
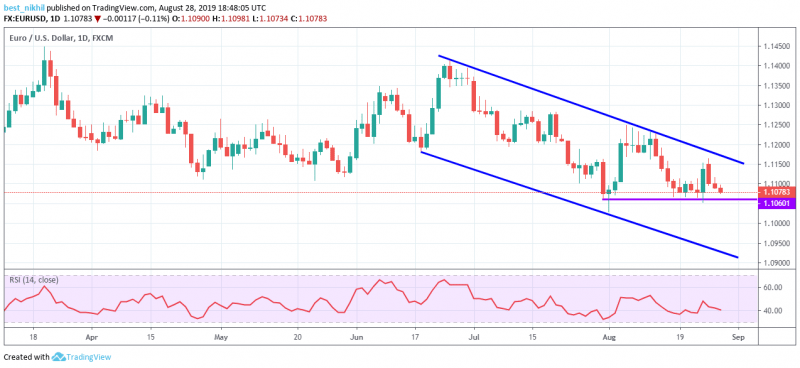
Meanwhile, the Relative Strength Index (RSI) was indicating 40 level, showing weak buyer interest. Earlier the day, German September Gfk Consumer Confidence Survey rose 0.1 points reporting 9.7 points over the 9.6 points estimates. Anyhow, the pair appeared to pay more attention towards downbeat data releases. German July MoM Import Price Index recorded -0.2% over 0.0% consensus estimates. Also, Italian August Business Confidence came out 99.7 points, slightly lower than the 99.8 points market hopes. Later the day, German 10-year bond yield published around -0.70% in comparison to the last -0.41%.
USD/CHF
The Swiss Franc pair bulls were strongly moving to the north side, aiming the overhead red Ichimoku Clouds. Quite noticeably, the pair had already crossed above the base line and the conversion line, strengthening the bulls.
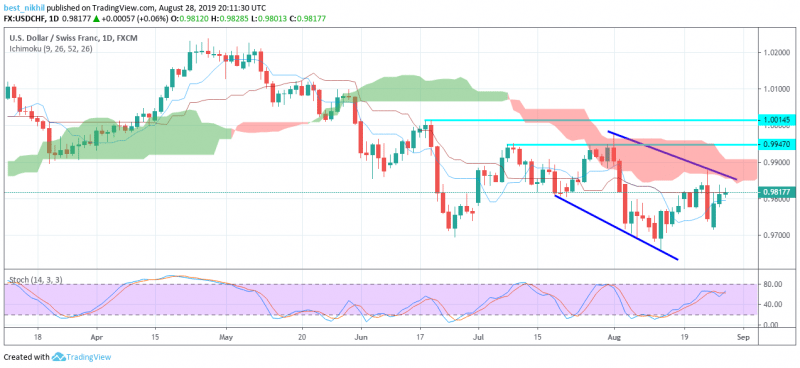
On the economic side, Switzerland August ZEW Survey – Expectations remained at the center stage on Wednesday. The actual reports came near -37.5 points over -24.0 points market hopes. On an overall view, the USD/CHF pair was forming a falling wedge trading pattern. Also, the Stochastic technical indicator was almost near the overbought levels. Meantime, strong resistances remained stalled near 0.9947 and 1.0015 levels, capping daily gains. Meantime, on the technical side, the US Dollar Index kept moving in the upper region of the Bollinger Bands.
This article was originally posted on FX Empire
More From FXEMPIRE:
Crude Oil Price Forecast – Crude oil markets rally after bullish inventory figures
Gold Price Forecast – Gold markets pressing top of consolidation
Gold Price Prediction – Prices Consolidate Despite Rising Geopolitical Risks
US Stock Market Overview – Stocks Rally, Led by Energy as Dorian is Upgraded to a Hurricane
