
 Yahoo Finance
 Fly Leasing (FLY) to Report Q2 Earnings: What's in Store?
Fly Leasing Limited FLY is scheduled to release second-quarter 2019 results on Aug 22, before market open. The Zacks Consensus Estimate for the top and the bottom line stands at $142.91 million and $1.45 per share, respectively, in the to-be-reported quarter.
In the last reported quarter, Fly Leasing’s earnings surpassed the Zacks Consensus Estimate by 26 cents. Results were aided by higher operating lease revenues.
As far as earnings surprises are concerned, the company boasts an impressive record. Fly Leasing outpaced the Zacks Consensus Estimate in each of the trailing four quarters. This is depicted in the graph below.
Fly Leasing Limited Price and EPS Surprise
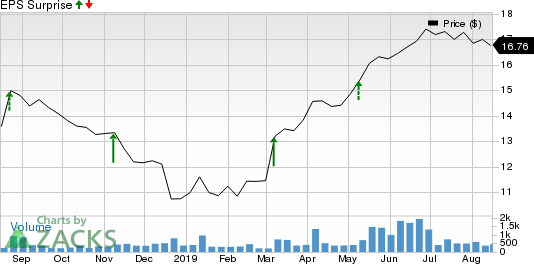
Fly Leasing Limited price-eps-surprise | Fly Leasing Limited Quote
Let’s delve deeper to find out the factors that will likely impact Fly Leasing’s second-quarter 2019 results.
Despite the U.S.-China trade war-related uncertainties, demand for leased aircraft continues to be impressive and should aid results in the quarter to be reported. We anticipate operating lease rental revenues, which accounts for bulk of the company’s top line, to display a solid year-over-year uptick in the June quarter.
Additionally, Fly Leasing’s second-quarter results are likely to benefit from growth in the Asia-Pacific region, the largest market for the company. Efforts to control selling, general and administrative costs too may aid the bottom line in the upcoming quarterly release.
However, high interest expenses could hurt second-quarter results as was the case with another leasing company, Air Lease Corporation AL. Delivery delays from the likes of Airbus might as well marFly Leasing’s earnings prospects.
Earnings Whispers
Our proven model does not conclusively show that Fly Leasing is likely to beat estimates this earnings season. This is because a stock needs to have both — a positive Earnings ESP and a favorable Zacks Rank #1 (Strong Buy), 2 (Buy) or 3 (Hold) — for this to happen. Zacks Rank #4 (Sell) or 5 (Strong Sell) stocks are best avoided, especially if they have a negative Earnings ESP. You can uncover the best stocks to buy or sell before they’re reported with our Earnings ESP Filter.
Zacks Rank: Fly Leasing carries a Zacks Rank #3, which increases the predictive power of ESP.
Earnings ESP: Fly Leasing has an Earnings ESP of -2.54% that acts as a spoiler in the stock’s combination, leaving surprise prediction inconclusive.
Stocks to Consider
Investors interested in the broader Transportation sector may consider Delta Air Lines DAL and The Greenbrier Companies GBX as these stocks possess the right mix of elements to beat on earnings in the next releases.
Delta has an Earnings ESP of +3.22% and a Zacks Rank of 1. You can see the complete list of today’s Zacks #1 Rank stocks here.
Greenbrier Companies has a Zacks Rank of 3 and an Earnings ESP of +4.42%.
Today's Best Stocks from Zacks
Would you like to see the updated picks from our best market-beating strategies? From 2017 through 2018, while the S&P 500 gained +15.8%, five of our screens returned +38.0%, +61.3%, +61.6%, +68.1%, and +98.3%.
This outperformance has not just been a recent phenomenon. From 2000 – 2018, while the S&P averaged +4.8% per year, our top strategies averaged up to +56.2% per year.
See their latest picks free >>
Want the latest recommendations from Zacks Investment Research? Today, you can download 7 Best Stocks for the Next 30 Days. Click to get this free report
Delta Air Lines, Inc. (DAL) : Free Stock Analysis Report
Air Lease Corporation (AL) : Free Stock Analysis Report
Fly Leasing Limited (FLY) : Free Stock Analysis Report
Greenbrier Companies, Inc. (The) (GBX) : Free Stock Analysis Report
To read this article on Zacks.com click here.
Zacks Investment Research
