
 Yahoo Finance
 FLEX Q4 Earnings and Revenues Beat Estimates, Increase Y/Y
Flex Ltd FLEX reported fourth-quarter fiscal 2023 adjusted earnings of 57 cents per share, beating the Zacks Consensus Estimate by 11.8%. The bottom line grew 9.6% year over year.
Revenues increased 9% year over year to $7.5 billion, surpassing the consensus mark by 4.1%. The company benefited from strength across the Agility Solutions and Reliability Solutions segments.
In the past year, the stock has increased 34.8% against the sub-industry’s decline of 2.4%.
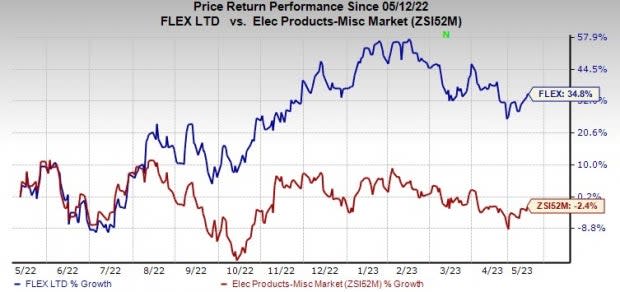
Image Source: Zacks Investment Research
Segment Details
The Flex Reliability Solutions Group comprises Health Solutions, Automotive and Industrial businesses. Revenues improved 14% year over year to $3.2 billion. Demand remained healthy across the business segment, partly offset by the semiconductor shortage.
The Flex Agility Solutions Group comprises Communications & Enterprise Compute or CEC and Lifestyle and Consumer Devices businesses. Revenues were up 5% year over year to $3.7 billion. Momentum in CEC business and cost saving efforts across Lifestyle and Consumer Devices business were the driving factors.
The Nextracker Group’s revenues rose 18% year over year to $0.5 billion.
Flex Ltd. Price, Consensus and EPS Surprise
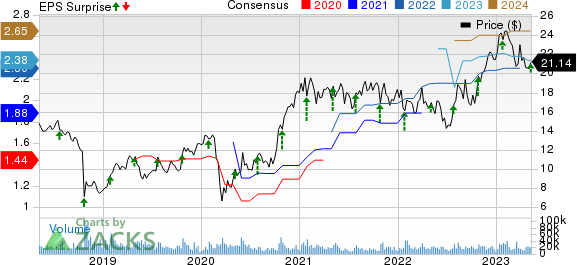
Flex Ltd. price-consensus-eps-surprise-chart | Flex Ltd. Quote
Operating Details
Non-GAAP gross margin increased 60 bps on a year-over-year basis to 7.9% in the reported quarter.
Non-GAAP selling, general & administrative expenses, as a percentage of revenues, were 3.1%, which increased 10 bps from the prior-year period.
Non-GAAP operating margin expanded 60 bps year over year to 4.9%.
Adjusted operating margins of the Flex Agility Solutions Group and the Nextracker Group were 4.6% and 13.5%, up 40 bps and 850 bps, respectively, year over year. The Flex Reliability Solutions Group’s adjusted operating margin was 4.4%, down 50 bps.
Balance Sheet & Cash Flow
As of Mar 31, cash & cash equivalents totaled $3.29 billion compared with $2.57 billion as of Dec 31, 2022.
As of Mar 31, total debt (net of current portion) were $3.69 billion compared with $3.52 billion as of Dec 31, 2022.
In fourth-quarter fiscal 2023, the company generated cash flow from operating activities of $450 million and an adjusted free cash flow of $270 million.
In the quarter under review, FLEX repurchased shares worth $44 million.
Guidance
For first-quarter fiscal 2024, Flex expects revenues to be between $7 billion and $7.5 billion.
Management expects adjusted earnings in the range of 47-53 cents per share. Adjusted operating income is projected to be between $320 million and $350 million.
For fiscal 2024, Flex expects revenues to be between $30.5 billion and $31.5 billion. It anticipates adjusted earnings in the range of $2.35-$2.55per share. Adjusted operating margin is projected in the range of 4.9-5.1%
Zacks Rank & Stocks to Consider
Flex currently carries a Zacks Rank #4 (Sell).
Some better-ranked stocks in the broader technology space are Badger Meter BMI, Watts Water Technologies WTS and Blackbaud BLKB. BMI and BLKB sport a Zacks Rank #1 (Strong Buy) whereas WTS currently carries a Zacks Rank #2 (Buy). You can see the complete list of today’s Zacks #1 Rank stocks here.
The Zacks Consensus Estimate for Badger Meter’s 2023 earnings has increased 4.7% in the past 60 days to $2.69 per share. BMI’s earnings beat the Zacks Consensus Estimate in the last four quarters, the average being 5.3%. Shares of BMI have surged 79.4% in the past year.
The Zacks Consensus Estimate for WTS’ 2023 earnings has increased 5.3% in the past 60 days to $7.19 per share. The long-term earnings growth rate is expected to be 8%.
WTS’ earnings beat the Zacks Consensus Estimate in the last four quarters, the average surprise being 16.3%. Shares of WTS have gained 29.3% in the past year.
The Zacks Consensus Estimate for Blackbaud’s 2023 earnings is pegged at $3.68 per share, up 7.3% in the past 60 days. The long-term earnings growth rate is anticipated to be 10.4%.
Blackbaud’s earnings beat the Zacks Consensus Estimate in the last four quarters, the average being 10.4%. Shares of BLKB have increased 37.2% in the past year.
Want the latest recommendations from Zacks Investment Research? Today, you can download 7 Best Stocks for the Next 30 Days. Click to get this free report
Badger Meter, Inc. (BMI) : Free Stock Analysis Report
Flex Ltd. (FLEX) : Free Stock Analysis Report
Blackbaud, Inc. (BLKB) : Free Stock Analysis Report
Watts Water Technologies, Inc. (WTS) : Free Stock Analysis Report
