
 Yahoo Finance
 Flex Ltd.'s (NASDAQ:FLEX) Stock Is Going Strong: Is the Market Following Fundamentals?
Flex's (NASDAQ:FLEX) stock is up by a considerable 12% over the past month. Given that the market rewards strong financials in the long-term, we wonder if that is the case in this instance. Particularly, we will be paying attention to Flex's ROE today.
Return on Equity or ROE is a test of how effectively a company is growing its value and managing investors’ money. In short, ROE shows the profit each dollar generates with respect to its shareholder investments.
Check out our latest analysis for Flex
How Do You Calculate Return On Equity?
Return on equity can be calculated by using the formula:
Return on Equity = Net Profit (from continuing operations) ÷ Shareholders' Equity
So, based on the above formula, the ROE for Flex is:
19% = US$831m ÷ US$4.3b (Based on the trailing twelve months to September 2022).
The 'return' is the profit over the last twelve months. Another way to think of that is that for every $1 worth of equity, the company was able to earn $0.19 in profit.
What Is The Relationship Between ROE And Earnings Growth?
We have already established that ROE serves as an efficient profit-generating gauge for a company's future earnings. Based on how much of its profits the company chooses to reinvest or "retain", we are then able to evaluate a company's future ability to generate profits. Assuming all else is equal, companies that have both a higher return on equity and higher profit retention are usually the ones that have a higher growth rate when compared to companies that don't have the same features.
Flex's Earnings Growth And 19% ROE
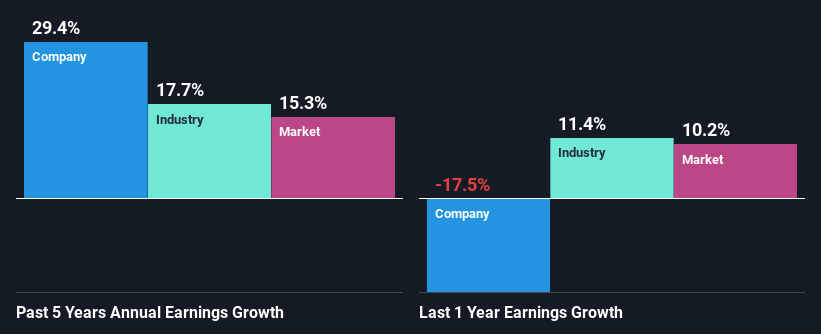
To start with, Flex's ROE looks acceptable. Further, the company's ROE compares quite favorably to the industry average of 14%. This certainly adds some context to Flex's exceptional 29% net income growth seen over the past five years. We believe that there might also be other aspects that are positively influencing the company's earnings growth. Such as - high earnings retention or an efficient management in place.
We then compared Flex's net income growth with the industry and we're pleased to see that the company's growth figure is higher when compared with the industry which has a growth rate of 18% in the same period.
Earnings growth is a huge factor in stock valuation. The investor should try to establish if the expected growth or decline in earnings, whichever the case may be, is priced in. This then helps them determine if the stock is placed for a bright or bleak future. Has the market priced in the future outlook for FLEX? You can find out in our latest intrinsic value infographic research report.
Is Flex Using Its Retained Earnings Effectively?
Given that Flex doesn't pay any dividend to its shareholders, we infer that the company has been reinvesting all of its profits to grow its business.
Summary
Overall, we are quite pleased with Flex's performance. Specifically, we like that the company is reinvesting a huge chunk of its profits at a high rate of return. This of course has caused the company to see substantial growth in its earnings. That being so, a study of the latest analyst forecasts show that the company is expected to see a slowdown in its future earnings growth. To know more about the company's future earnings growth forecasts take a look at this free report on analyst forecasts for the company to find out more.
Have feedback on this article? Concerned about the content? Get in touch with us directly. Alternatively, email editorial-team (at) simplywallst.com.
This article by Simply Wall St is general in nature. We provide commentary based on historical data and analyst forecasts only using an unbiased methodology and our articles are not intended to be financial advice. It does not constitute a recommendation to buy or sell any stock, and does not take account of your objectives, or your financial situation. We aim to bring you long-term focused analysis driven by fundamental data. Note that our analysis may not factor in the latest price-sensitive company announcements or qualitative material. Simply Wall St has no position in any stocks mentioned.
Join A Paid User Research Session
You’ll receive a US$30 Amazon Gift card for 1 hour of your time while helping us build better investing tools for the individual investors like yourself. Sign up here
