
 Yahoo Finance
 Flex (FLEX) Q1 Earnings & Revenues Top Estimates, Up Y/Y
Flex Ltd. FLEX reported first-quarter fiscal 2023 adjusted earnings of 54 cents per share, beating the Zacks Consensus Estimate by 10.2%. The bottom line also grew 17.4% year over year.
Revenues increased 16% year over year to $7.3 billion and surpassed the consensus mark by 8.1%. The company benefited from strength across the Agility Solutions and Reliability Solutions segments, along with a solid end-market focus on the back of emerging opportunities.
Flex Ltd. Price, Consensus and EPS Surprise
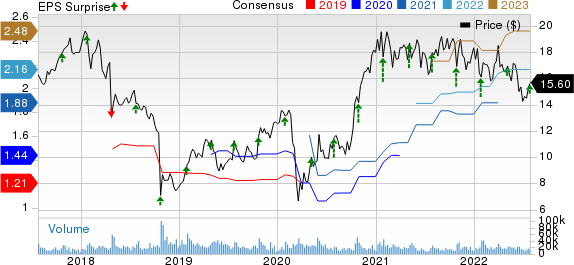
Flex Ltd. price-consensus-eps-surprise-chart | Flex Ltd. Quote
Segment Details
The Flex Agility Solutions Group comprises the Communications & Enterprise Compute or CEC, Lifestyle, and Consumer Devices businesses. The group’s revenues were up 16% year over year to $4 billion.
Agility continued to grow at a profitable rate. The increases in CEC and Lifestyle were partially offset by supply-chain constraints.
The Flex Reliability Solutions Group comprises the Health Solutions, Automotive and Industrial businesses. The group’s revenues went up 15% year over year to $3 billion. Demand remained healthy across the business segment, which was partly offset by supply-chain constraints.
Operating Details
The non-GAAP gross margin contracted 10 basis points (bps) on a year-over-year basis to 7.4% in the reported quarter.
The non-GAAP selling, general & administrative (SG&A) expenses, as a percentage of revenues were 2.9% which remained unchanged from the prior-year period.
The non-GAAP operating margin also fell 10 bps year over year to 4.5% on a year-over-year basis.
The Flex Agility Solutions Group’s adjusted operating margin was 4.3%, up 30 bps year over year. The Flex Reliability Solutions Group’s adjusted operating margin was 5%, down 63 bps.
Balance Sheet & Cash Flow
As of Jul 1, 2022, cash & cash equivalents stood at $2.65 billion compared with $2.96 billion as of Mar 31, 2021.
As of Jul 1, total debt (net of current portion) stood at $3.13 billion compared with $3.24 billion as of Mar 31, 2021.
In first-quarter fiscal 2023, the company generated cash flow from operating activities of $38 million and a negative adjusted free cash flow of $53 million.
Guidance
For second-quarter fiscal 2023, Flex expects revenues between $7 billion and $7.4 billion.
It expects adjusted earnings of 48-54 cents per share. The adjusted operating income is projected between $315 million and $345 million.
For fiscal 2023, Flex expects revenues between $28.4 billion and $29.4 billion.
It expects adjusted earnings of $2.09-$2.24 per share. The adjusted operating income margin is projected to be 4.6-4.8%.
Zacks Rank & Stocks to Consider
Flex currently carries a Zacks Rank #3 (Hold).
Some better-ranked stocks from the broader technology space are Aspen Technology AZPN, Synopsys SNPS and InterDigital Inc. IDCC. Aspen Technology, Synopsys and InterDigital each carry a Zacks Rank #2 (Buy).You can see the complete list of today’s Zacks #1 Rank (Strong Buy) stocks here.
The Zacks Consensus Estimate for Aspen Technology’s 2022 earnings is pegged at $5.49 per share, increasing 0.4% in the past 60 days. The long-term earnings growth rate is anticipated to be 16.3%.
Aspen Technology’s earnings beat the Zacks Consensus Estimate in the last four quarters, the average being 4.1%. Shares of AZPN have soared 34.9% in the past year.
The Zacks Consensus Estimate for Synopsys 2022 earnings is pegged at $8.67 per share, unchanged in the past 60 days. The long-term earnings growth rate is anticipated to be 19.6%.
Synopsys earnings beat the Zacks Consensus Estimate in the last four quarters, the average being 2.7%. Shares of SNPS have jumped 24.6% in the past year.
The Zacks Consensus Estimate for InterDigital’s 2022 earnings is pegged at $2.76 per share, declining 15.9% in the past 60 days. The long-term earnings growth rate is anticipated to be 15%.
InterDigital’s earnings beat the Zacks Consensus Estimate in the last four quarters, the average being 141.1%. Shares of IDCC have declined 8.7% in the past year.
Want the latest recommendations from Zacks Investment Research? Today, you can download 7 Best Stocks for the Next 30 Days. Click to get this free report
Flex Ltd. (FLEX) : Free Stock Analysis Report
InterDigital, Inc. (IDCC) : Free Stock Analysis Report
Synopsys, Inc. (SNPS) : Free Stock Analysis Report
Aspen Technology, Inc. (AZPN) : Free Stock Analysis Report
To read this article on Zacks.com click here.
Zacks Investment Research
