
 Yahoo Finance
 Fleetwood Corporation Limited (ASX:FWD) Might Not Be A Great Investment

Today we are going to look at Fleetwood Corporation Limited (ASX:FWD) to see whether it might be an attractive investment prospect. Specifically, we're going to calculate its Return On Capital Employed (ROCE), in the hopes of getting some insight into the business.
First, we'll go over how we calculate ROCE. Second, we'll look at its ROCE compared to similar companies. And finally, we'll look at how its current liabilities are impacting its ROCE.
What is Return On Capital Employed (ROCE)?
ROCE measures the amount of pre-tax profits a company can generate from the capital employed in its business. Generally speaking a higher ROCE is better. Ultimately, it is a useful but imperfect metric. Renowned investment researcher Michael Mauboussin has suggested that a high ROCE can indicate that 'one dollar invested in the company generates value of more than one dollar'.
So, How Do We Calculate ROCE?
Analysts use this formula to calculate return on capital employed:
Return on Capital Employed = Earnings Before Interest and Tax (EBIT) ÷ (Total Assets - Current Liabilities)
Or for Fleetwood:
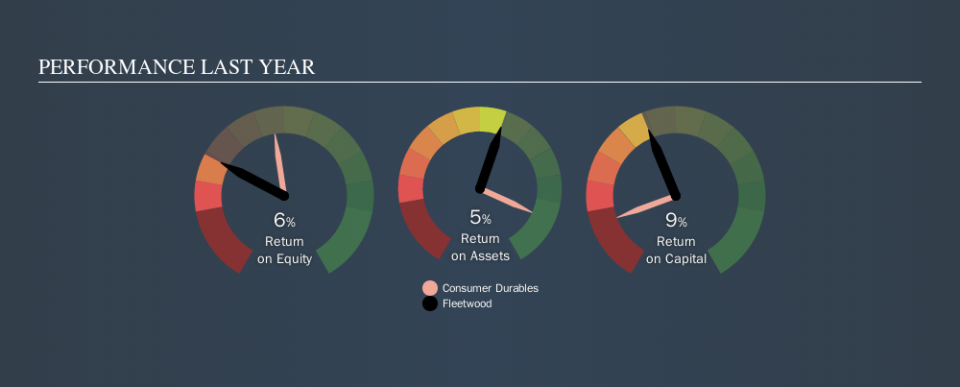
0.093 = AU$22m ÷ (AU$313m - AU$74m) (Based on the trailing twelve months to June 2019.)
Therefore, Fleetwood has an ROCE of 9.3%.
See our latest analysis for Fleetwood
Does Fleetwood Have A Good ROCE?
When making comparisons between similar businesses, investors may find ROCE useful. In this analysis, Fleetwood's ROCE appears meaningfully below the 20% average reported by the Consumer Durables industry. This performance could be negative if sustained, as it suggests the business may underperform its industry. Setting aside the industry comparison for now, Fleetwood's ROCE is mediocre in absolute terms, considering the risk of investing in stocks versus the safety of a bank account. Investors may wish to consider higher-performing investments.
Fleetwood delivered an ROCE of 9.3%, which is better than 3 years ago, as was making losses back then. That suggests the business has returned to profitability. The image below shows how Fleetwood's ROCE compares to its industry, and you can click it to see more detail on its past growth.
When considering ROCE, bear in mind that it reflects the past and does not necessarily predict the future. ROCE can be misleading for companies in cyclical industries, with returns looking impressive during the boom times, but very weak during the busts. ROCE is only a point-in-time measure. What happens in the future is pretty important for investors, so we have prepared a free report on analyst forecasts for Fleetwood.
Fleetwood's Current Liabilities And Their Impact On Its ROCE
Liabilities, such as supplier bills and bank overdrafts, are referred to as current liabilities if they need to be paid within 12 months. Due to the way the ROCE equation works, having large bills due in the near term can make it look as though a company has less capital employed, and thus a higher ROCE than usual. To counter this, investors can check if a company has high current liabilities relative to total assets.
Fleetwood has total assets of AU$313m and current liabilities of AU$74m. As a result, its current liabilities are equal to approximately 24% of its total assets. It is good to see a restrained amount of current liabilities, as this limits the effect on ROCE.
Our Take On Fleetwood's ROCE
If Fleetwood continues to earn an uninspiring ROCE, there may be better places to invest. Of course, you might also be able to find a better stock than Fleetwood. So you may wish to see this free collection of other companies that have grown earnings strongly.
I will like Fleetwood better if I see some big insider buys. While we wait, check out this free list of growing companies with considerable, recent, insider buying.
We aim to bring you long-term focused research analysis driven by fundamental data. Note that our analysis may not factor in the latest price-sensitive company announcements or qualitative material.
If you spot an error that warrants correction, please contact the editor at editorial-team@simplywallst.com. This article by Simply Wall St is general in nature. It does not constitute a recommendation to buy or sell any stock, and does not take account of your objectives, or your financial situation. Simply Wall St has no position in the stocks mentioned. Thank you for reading.
