
 Yahoo Finance
 The five-year underlying earnings growth at Mulberry Group (LON:MUL) is promising, but the shareholders are still in the red over that time
Statistically speaking, long term investing is a profitable endeavour. But unfortunately, some companies simply don't succeed. For example the Mulberry Group plc (LON:MUL) share price dropped 63% over five years. We certainly feel for shareholders who bought near the top. We also note that the stock has performed poorly over the last year, with the share price down 49%. Furthermore, it's down 33% in about a quarter. That's not much fun for holders.
Since Mulberry Group has shed UK£8.9m from its value in the past 7 days, let's see if the longer term decline has been driven by the business' economics.
See our latest analysis for Mulberry Group
In his essay The Superinvestors of Graham-and-Doddsville Warren Buffett described how share prices do not always rationally reflect the value of a business. One imperfect but simple way to consider how the market perception of a company has shifted is to compare the change in the earnings per share (EPS) with the share price movement.
During five years of share price growth, Mulberry Group moved from a loss to profitability. Most would consider that to be a good thing, so it's counter-intuitive to see the share price declining. Other metrics might give us a better handle on how its value is changing over time.
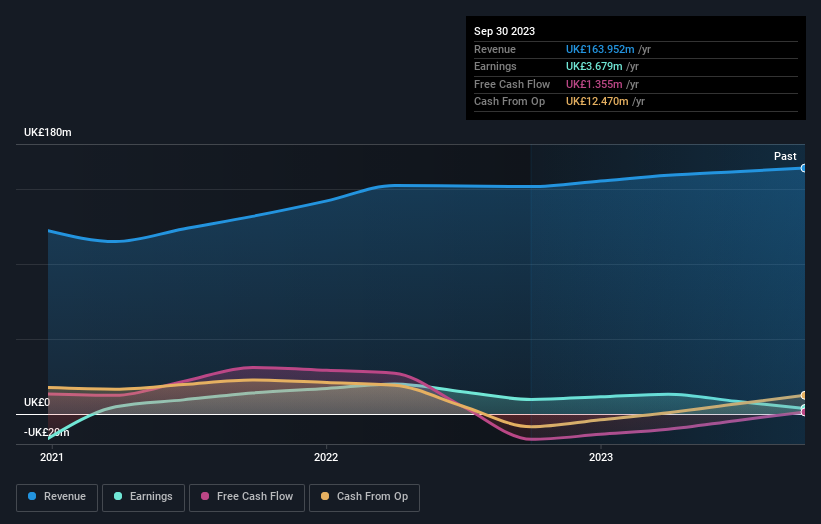
The modest 0.9% dividend yield is unlikely to be guiding the market view of the stock. The revenue decline of 0.9% isn't too bad. But it's quite possible the market had expected better; a closer look at the revenue trends might explain the pessimism.
The company's revenue and earnings (over time) are depicted in the image below (click to see the exact numbers).
This free interactive report on Mulberry Group's balance sheet strength is a great place to start, if you want to investigate the stock further.
A Different Perspective
Investors in Mulberry Group had a tough year, with a total loss of 49% (including dividends), against a market gain of about 7.6%. Even the share prices of good stocks drop sometimes, but we want to see improvements in the fundamental metrics of a business, before getting too interested. Unfortunately, last year's performance may indicate unresolved challenges, given that it was worse than the annualised loss of 10% over the last half decade. Generally speaking long term share price weakness can be a bad sign, though contrarian investors might want to research the stock in hope of a turnaround. While it is well worth considering the different impacts that market conditions can have on the share price, there are other factors that are even more important. To that end, you should be aware of the 5 warning signs we've spotted with Mulberry Group .
If you like to buy stocks alongside management, then you might just love this free list of companies. (Hint: insiders have been buying them).
Please note, the market returns quoted in this article reflect the market weighted average returns of stocks that currently trade on British exchanges.
Have feedback on this article? Concerned about the content? Get in touch with us directly. Alternatively, email editorial-team (at) simplywallst.com.
This article by Simply Wall St is general in nature. We provide commentary based on historical data and analyst forecasts only using an unbiased methodology and our articles are not intended to be financial advice. It does not constitute a recommendation to buy or sell any stock, and does not take account of your objectives, or your financial situation. We aim to bring you long-term focused analysis driven by fundamental data. Note that our analysis may not factor in the latest price-sensitive company announcements or qualitative material. Simply Wall St has no position in any stocks mentioned.
