
 Yahoo Finance
 What Is FIT Hon Teng's (HKG:6088) P/E Ratio After Its Share Price Rocketed?

Those holding FIT Hon Teng (HKG:6088) shares must be pleased that the share price has rebounded 36% in the last thirty days. But unfortunately, the stock is still down by 11% over a quarter. But shareholders may not all be feeling jubilant, since the share price is still down 32% in the last year.
All else being equal, a sharp share price increase should make a stock less attractive to potential investors. While the market sentiment towards a stock is very changeable, in the long run, the share price will tend to move in the same direction as earnings per share. The implication here is that deep value investors might steer clear when expectations of a company are too high. Perhaps the simplest way to get a read on investors' expectations of a business is to look at its Price to Earnings Ratio (PE Ratio). A high P/E ratio means that investors have a high expectation about future growth, while a low P/E ratio means they have low expectations about future growth.
See our latest analysis for FIT Hon Teng
Does FIT Hon Teng Have A Relatively High Or Low P/E For Its Industry?
FIT Hon Teng's P/E of 7.76 indicates relatively low sentiment towards the stock. The image below shows that FIT Hon Teng has a lower P/E than the average (9.4) P/E for companies in the electronic industry.
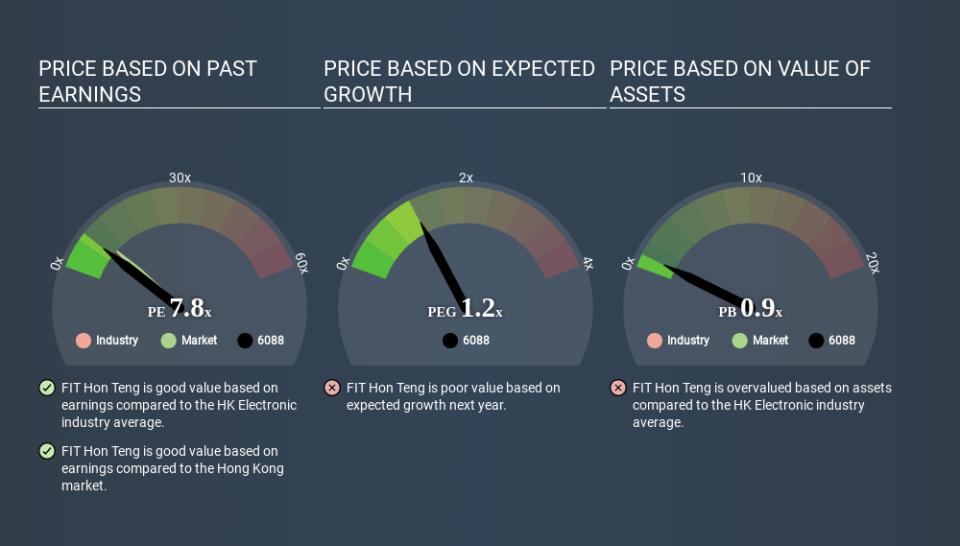
This suggests that market participants think FIT Hon Teng will underperform other companies in its industry. While current expectations are low, the stock could be undervalued if the situation is better than the market assumes. If you consider the stock interesting, further research is recommended. For example, I often monitor director buying and selling.
How Growth Rates Impact P/E Ratios
P/E ratios primarily reflect market expectations around earnings growth rates. Earnings growth means that in the future the 'E' will be higher. Therefore, even if you pay a high multiple of earnings now, that multiple will become lower in the future. A lower P/E should indicate the stock is cheap relative to others -- and that may attract buyers.
FIT Hon Teng's earnings per share grew by 2.0% in the last twelve months. And it has improved its earnings per share by 5.9% per year over the last three years.
Don't Forget: The P/E Does Not Account For Debt or Bank Deposits
Don't forget that the P/E ratio considers market capitalization. That means it doesn't take debt or cash into account. The exact same company would hypothetically deserve a higher P/E ratio if it had a strong balance sheet, than if it had a weak one with lots of debt, because a cashed up company can spend on growth.
Spending on growth might be good or bad a few years later, but the point is that the P/E ratio does not account for the option (or lack thereof).
So What Does FIT Hon Teng's Balance Sheet Tell Us?
The extra options and safety that comes with FIT Hon Teng's US$19m net cash position means that it deserves a higher P/E than it would if it had a lot of net debt.
The Verdict On FIT Hon Teng's P/E Ratio
FIT Hon Teng's P/E is 7.8 which is below average (9.7) in the HK market. Earnings improved over the last year. And the healthy balance sheet means the company can sustain growth while the P/E suggests shareholders don't think it will. What we know for sure is that investors are becoming less uncomfortable about FIT Hon Teng's prospects, since they have pushed its P/E ratio from 5.7 to 7.8 over the last month. If you like to buy stocks that could be turnaround opportunities, then this one might be a candidate; but if you're more sensitive to price, then you may feel the opportunity has passed.
When the market is wrong about a stock, it gives savvy investors an opportunity. As value investor Benjamin Graham famously said, 'In the short run, the market is a voting machine but in the long run, it is a weighing machine. So this free visualization of the analyst consensus on future earnings could help you make the right decision about whether to buy, sell, or hold.
You might be able to find a better buy than FIT Hon Teng. If you want a selection of possible winners, check out this free list of interesting companies that trade on a P/E below 20 (but have proven they can grow earnings).
Love or hate this article? Concerned about the content? Get in touch with us directly. Alternatively, email editorial-team@simplywallst.com.
This article by Simply Wall St is general in nature. It does not constitute a recommendation to buy or sell any stock, and does not take account of your objectives, or your financial situation. We aim to bring you long-term focused analysis driven by fundamental data. Note that our analysis may not factor in the latest price-sensitive company announcements or qualitative material. Simply Wall St has no position in any stocks mentioned. Thank you for reading.
