
 Yahoo Finance
 First Advantage (NASDAQ:FA) shareholders have endured a 27% loss from investing in the stock a year ago
Passive investing in an index fund is a good way to ensure your own returns roughly match the overall market. Active investors aim to buy stocks that vastly outperform the market - but in the process, they risk under-performance. For example, the First Advantage Corporation (NASDAQ:FA) share price is down 27% in the last year. That's disappointing when you consider the market declined 18%. First Advantage hasn't been listed for long, so although we're wary of recent listings that perform poorly, it may still prove itself with time. Even worse, it's down 13% in about a month, which isn't fun at all. This could be related to the recent financial results - you can catch up on the most recent data by reading our company report.
Since shareholders are down over the longer term, lets look at the underlying fundamentals over the that time and see if they've been consistent with returns.
Check out our latest analysis for First Advantage
While markets are a powerful pricing mechanism, share prices reflect investor sentiment, not just underlying business performance. One way to examine how market sentiment has changed over time is to look at the interaction between a company's share price and its earnings per share (EPS).
During the unfortunate twelve months during which the First Advantage share price fell, it actually saw its earnings per share (EPS) improve by 70%. It's quite possible that growth expectations may have been unreasonable in the past.
The divergence between the EPS and the share price is quite notable, during the year. So it's well worth checking out some other metrics, too.
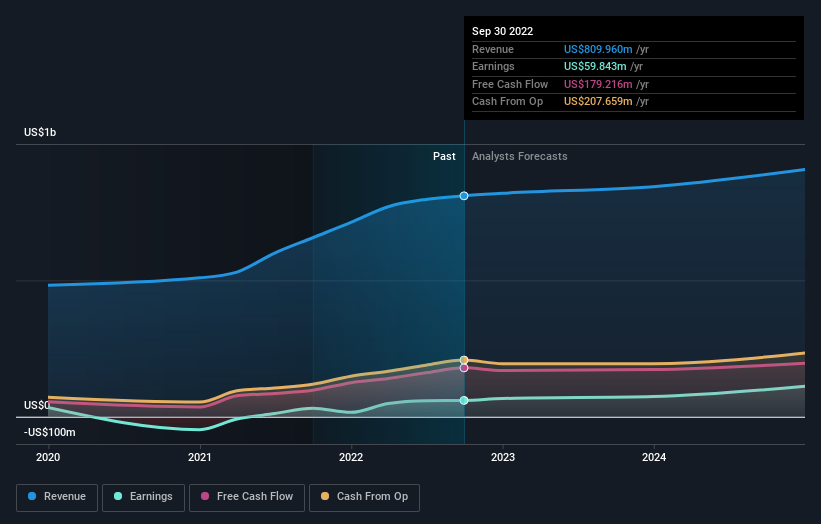
First Advantage managed to grow revenue over the last year, which is usually a real positive. Since we can't easily explain the share price movement based on these metrics, it might be worth considering how market sentiment has changed towards the stock.
The image below shows how earnings and revenue have tracked over time (if you click on the image you can see greater detail).
We know that First Advantage has improved its bottom line lately, but what does the future have in store? So we recommend checking out this free report showing consensus forecasts
A Different Perspective
We doubt First Advantage shareholders are happy with the loss of 27% over twelve months. That falls short of the market, which lost 18%. That's disappointing, but it's worth keeping in mind that the market-wide selling wouldn't have helped. With the stock down 9.0% over the last three months, the market doesn't seem to believe that the company has solved all its problems. Given the relatively short history of this stock, we'd remain pretty wary until we see some strong business performance. Before deciding if you like the current share price, check how First Advantage scores on these 3 valuation metrics.
If you like to buy stocks alongside management, then you might just love this free list of companies. (Hint: insiders have been buying them).
Please note, the market returns quoted in this article reflect the market weighted average returns of stocks that currently trade on US exchanges.
Have feedback on this article? Concerned about the content? Get in touch with us directly. Alternatively, email editorial-team (at) simplywallst.com.
This article by Simply Wall St is general in nature. We provide commentary based on historical data and analyst forecasts only using an unbiased methodology and our articles are not intended to be financial advice. It does not constitute a recommendation to buy or sell any stock, and does not take account of your objectives, or your financial situation. We aim to bring you long-term focused analysis driven by fundamental data. Note that our analysis may not factor in the latest price-sensitive company announcements or qualitative material. Simply Wall St has no position in any stocks mentioned.
Join A Paid User Research Session
You’ll receive a US$30 Amazon Gift card for 1 hour of your time while helping us build better investing tools for the individual investors like yourself. Sign up here
