
 Yahoo Finance
 How Financially Strong Is Sundance Energy Australia Limited (ASX:SEA)?

While small-cap stocks, such as Sundance Energy Australia Limited (ASX:SEA) with its market cap of US$535.68m, are popular for their explosive growth, investors should also be aware of their balance sheet to judge whether the company can survive a downturn. Oil and Gas companies, especially ones that are currently loss-making, are more likely to be higher risk. So, understanding the company’s financial health becomes vital. Here are a few basic checks that are good enough to have a broad overview of the company’s financial strength. Nevertheless, this commentary is still very high-level, so I recommend you dig deeper yourself into SEA here.
Does SEA produce enough cash relative to debt?
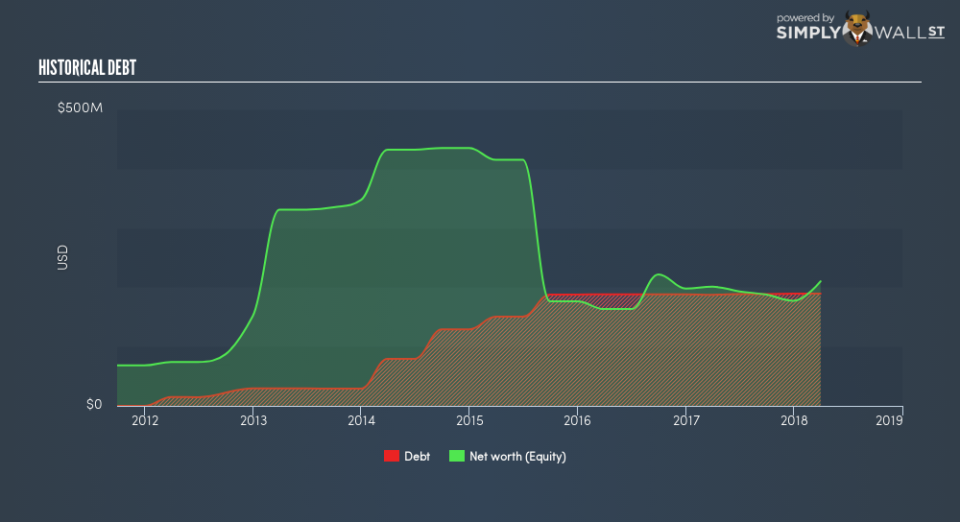
SEA’s debt level has been constant at around US$189.52m over the previous year comprising of short- and long-term debt. At this stable level of debt, the current cash and short-term investment levels stands at US$1.07m for investing into the business. Moreover, SEA has produced cash from operations of US$68.68m in the last twelve months, leading to an operating cash to total debt ratio of 36.24%, indicating that SEA’s debt is appropriately covered by operating cash. This ratio can also be interpreted as a measure of efficiency for loss making businesses as traditional metrics such as return on asset (ROA) requires a positive net income. In SEA’s case, it is able to generate 0.36x cash from its debt capital.
Can SEA pay its short-term liabilities?
At the current liabilities level of US$77.66m liabilities, it appears that the company has been able to meet these commitments with a current assets level of US$116.49m, leading to a 1.5x current account ratio. For Oil and Gas companies, this ratio is within a sensible range since there is a bit of a cash buffer without leaving too much capital in a low-return environment.
Can SEA service its debt comfortably?
With a debt-to-equity ratio of 90.22%, SEA can be considered as an above-average leveraged company. This is not uncommon for a small-cap company given that debt tends to be lower-cost and at times, more accessible. Though, since SEA is presently unprofitable, sustainability of its current state of operations becomes a concern. Maintaining a high level of debt, while revenues are still below costs, can be dangerous as liquidity tends to dry up in unexpected downturns.
Next Steps:
Although SEA’s debt level is towards the higher end of the spectrum, its cash flow coverage seems adequate to meet obligations which means its debt is being efficiently utilised. This may mean this is an optimal capital structure for the business, given that it is also meeting its short-term commitment. This is only a rough assessment of financial health, and I’m sure SEA has company-specific issues impacting its capital structure decisions. I suggest you continue to research Sundance Energy Australia to get a better picture of the small-cap by looking at:
Future Outlook: What are well-informed industry analysts predicting for SEA’s future growth? Take a look at our free research report of analyst consensus for SEA’s outlook.
Valuation: What is SEA worth today? Is the stock undervalued, even when its growth outlook is factored into its intrinsic value? The intrinsic value infographic in our free research report helps visualize whether SEA is currently mispriced by the market.
Other High-Performing Stocks: Are there other stocks that provide better prospects with proven track records? Explore our free list of these great stocks here.
To help readers see past the short term volatility of the financial market, we aim to bring you a long-term focused research analysis purely driven by fundamental data. Note that our analysis does not factor in the latest price-sensitive company announcements.
The author is an independent contributor and at the time of publication had no position in the stocks mentioned. For errors that warrant correction please contact the editor at editorial-team@simplywallst.com.
