
 Yahoo Finance
 Fiducian Group Limited (ASX:FID): Has Recent Earnings Growth Beaten Long-Term Trend?

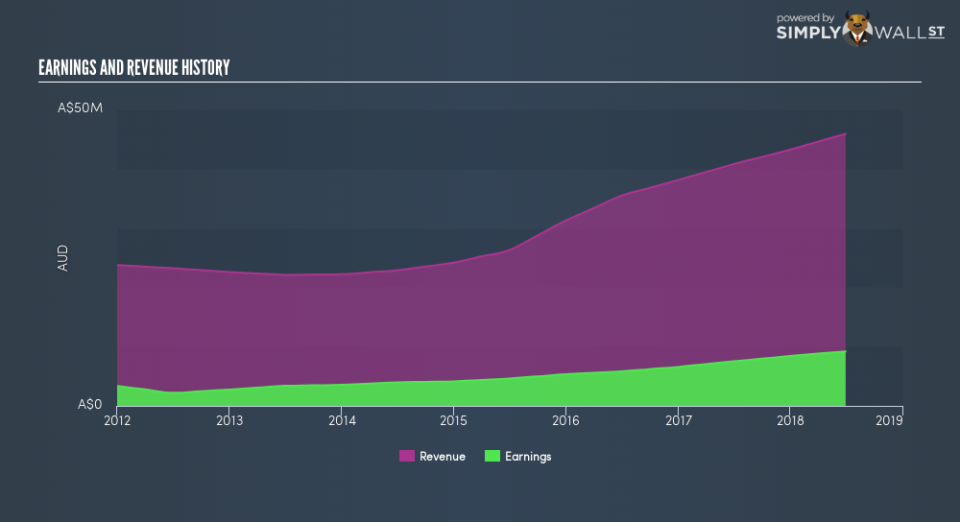
When Fiducian Group Limited (ASX:FID) released its most recent earnings update (30 June 2018), I wanted to understand how these figures stacked up against its past performance. The two benchmarks I used were Fiducian Group’s average earnings over the past couple of years, and its industry performance. These are useful yardsticks to help me gauge whether or not FID actually performed well. Below is a quick commentary on how I see FID has performed.
Check out our latest analysis for Fiducian Group
Could FID beat the long-term trend and outperform its industry?
FID’s trailing twelve-month earnings (from 30 June 2018) of AU$9.2m has jumped 22% compared to the previous year.
Furthermore, this one-year growth rate has exceeded its 5-year annual growth average of 21%, indicating the rate at which FID is growing has accelerated. What’s enabled this growth? Let’s take a look at whether it is solely attributable to an industry uplift, or if Fiducian Group has seen some company-specific growth.
In terms of returns from investment, Fiducian Group has invested its equity funds well leading to a 30% return on equity (ROE), above the sensible minimum of 20%. Furthermore, its return on assets (ROA) of 23% exceeds the AU Capital Markets industry of 7.3%, indicating Fiducian Group has used its assets more efficiently. And finally, its return on capital (ROC), which also accounts for Fiducian Group’s debt level, has increased over the past 3 years from 33% to 41%.
What does this mean?
Though Fiducian Group’s past data is helpful, it is only one aspect of my investment thesis. Positive growth and profitability are what investors like to see in a company’s track record, but how do we properly assess sustainability? I suggest you continue to research Fiducian Group to get a better picture of the stock by looking at:
Future Outlook: What are well-informed industry analysts predicting for FID’s future growth? Take a look at our free research report of analyst consensus for FID’s outlook.
Financial Health: Are FID’s operations financially sustainable? Balance sheets can be hard to analyze, which is why we’ve done it for you. Check out our financial health checks here.
Other High-Performing Stocks: Are there other stocks that provide better prospects with proven track records? Explore our free list of these great stocks here.
NB: Figures in this article are calculated using data from the trailing twelve months from 30 June 2018. This may not be consistent with full year annual report figures.
To help readers see past the short term volatility of the financial market, we aim to bring you a long-term focused research analysis purely driven by fundamental data. Note that our analysis does not factor in the latest price-sensitive company announcements.
The author is an independent contributor and at the time of publication had no position in the stocks mentioned. For errors that warrant correction please contact the editor at editorial-team@simplywallst.com.
