
 Yahoo Finance
 Fentura Financial, Inc. Announces Third Quarter 2022 Earnings (Unaudited)

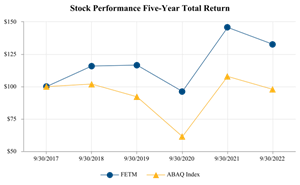
Figure 1
Dollars in thousands except per share amounts. Certain items in the prior period financial statements have been reclassified to conform with the September 30, 2022 presentation.
FENTON, Mich., Nov. 01, 2022 (GLOBE NEWSWIRE) -- Fentura Financial, Inc. (OTCQX: FETM) announces quarterly results of net income of $4,009 and $10,569 for the three and nine months ended September 30, 2022.
Ronald L. Justice, President and CEO, stated, "Our solid quarterly performance is reflective of a strong increase in net interest income from significant balance sheet growth. Both, balance sheet growth and rate trends during the quarter resulted in an improved net interest margin as well. Partially offsetting net interest income increase were reduction in gains on the sale of residential mortgages and provisions to the allowance for loan and lease losses. Provision increases were based on maintaining an appropriate reserve due to loan growth. We continue to monitor economic trend and concerns expressed in the market relating to a slowdown, but are encouraged by local loan demand and strong asset quality trends."
Following is a discussion of our financial performance as of, and for the three and nine months ended September 30, 2022. At the end of this document is a list of abbreviations and acronyms.
Results of Operations
The following table outlines our QTD results of operations and provides certain performance measures as of, and for the three months ended:
|
| 9/30/2022 |
| 6/30/2022 |
| 3/31/2022 |
| 12/31/2021 |
| 9/30/2021 | ||||||||||
INCOME STATEMENT DATA |
|
|
|
|
|
|
|
|
|
| ||||||||||
Interest income |
| $ | 15,726 |
|
| $ | 13,411 |
|
| $ | 12,301 |
|
| $ | 11,749 |
|
| $ | 11,584 |
|
Interest expense |
|
| 1,738 |
|
|
| 785 |
|
|
| 599 |
|
|
| 645 |
|
|
| 653 |
|
Net interest income |
|
| 13,988 |
|
|
| 12,626 |
|
|
| 11,702 |
|
|
| 11,104 |
|
|
| 10,931 |
|
Provision for loan losses |
|
| 1,231 |
|
|
| 525 |
|
|
| 502 |
|
|
| 38 |
|
|
| (436 | ) |
Noninterest income |
|
| 2,377 |
|
|
| 2,778 |
|
|
| 2,792 |
|
|
| 3,097 |
|
|
| 2,899 |
|
Noninterest expenses |
|
| 10,125 |
|
|
| 10,544 |
|
|
| 10,151 |
|
|
| 9,957 |
|
|
| 9,453 |
|
Federal income tax expense |
|
| 1,000 |
|
|
| 859 |
|
|
| 757 |
|
|
| 864 |
|
|
| 958 |
|
Net income |
| $ | 4,009 |
|
| $ | 3,476 |
|
| $ | 3,084 |
|
| $ | 3,342 |
|
| $ | 3,855 |
|
PER SHARE |
|
|
|
|
|
|
|
|
|
| ||||||||||
Earnings |
| $ | 0.91 |
|
| $ | 0.79 |
|
| $ | 0.69 |
|
| $ | 0.74 |
|
| $ | 0.84 |
|
Dividends |
| $ | 0.09 |
|
| $ | 0.09 |
|
| $ | 0.09 |
|
| $ | 0.08 |
|
| $ | 0.08 |
|
Tangible book value(1) |
| $ | 25.22 |
|
| $ | 24.53 |
|
| $ | 24.97 |
|
| $ | 25.43 |
|
| $ | 26.53 |
|
Quoted market value |
|
|
|
|
|
|
|
|
|
| ||||||||||
High |
| $ | 25.20 |
|
| $ | 27.85 |
|
| $ | 29.25 |
|
| $ | 28.28 |
|
| $ | 26.25 |
|
Low |
| $ | 23.00 |
|
| $ | 24.40 |
|
| $ | 27.10 |
|
| $ | 25.75 |
|
| $ | 25.60 |
|
Close(1) |
| $ | 23.00 |
|
| $ | 25.00 |
|
| $ | 27.90 |
|
| $ | 28.28 |
|
| $ | 25.75 |
|
PERFORMANCE RATIOS |
|
|
|
|
|
|
|
|
|
| ||||||||||
Return on average assets |
|
| 1.02 | % |
|
| 0.96 | % |
|
| 0.86 | % |
|
| 0.98 | % |
|
| 1.16 | % |
Return on average shareholders' equity |
|
| 12.96 | % |
|
| 11.55 | % |
|
| 10.53 | % |
|
| 10.56 | % |
|
| 12.26 | % |
Return on average tangible shareholders' equity |
|
| 14.10 | % |
|
| 12.60 | % |
|
| 11.49 | % |
|
| 10.87 | % |
|
| 12.63 | % |
Efficiency ratio |
|
| 61.87 | % |
|
| 68.45 | % |
|
| 70.04 | % |
|
| 70.11 | % |
|
| 68.35 | % |
Yield on earning assets (FTE) |
|
| 4.27 | % |
|
| 3.96 | % |
|
| 3.70 | % |
|
| 3.67 | % |
|
| 3.69 | % |
Rate on interest bearing liabilities |
|
| 0.75 | % |
|
| 0.38 | % |
|
| 0.29 | % |
|
| 0.33 | % |
|
| 0.34 | % |
Net interest margin to earning assets (FTE) |
|
| 3.79 | % |
|
| 3.73 | % |
|
| 3.52 | % |
|
| 3.47 | % |
|
| 3.48 | % |
BALANCE SHEET DATA(1) |
|
|
|
|
|
|
|
|
|
| ||||||||||
Total investment securities |
| $ | 129,886 |
|
| $ | 136,725 |
|
| $ | 151,579 |
|
| $ | 164,942 |
|
| $ | 138,476 |
|
Gross loans |
| $ | 1,350,851 |
|
| $ | 1,232,892 |
|
| $ | 1,139,351 |
|
| $ | 1,100,092 |
|
| $ | 1,015,177 |
|
Allowance for loan losses |
| $ | 12,200 |
|
| $ | 11,000 |
|
| $ | 11,000 |
|
| $ | 10,500 |
|
| $ | 10,500 |
|
Total assets |
| $ | 1,595,126 |
|
| $ | 1,474,307 |
|
| $ | 1,435,501 |
|
| $ | 1,417,801 |
|
| $ | 1,329,300 |
|
Total deposits |
| $ | 1,345,209 |
|
| $ | 1,231,543 |
|
| $ | 1,252,892 |
|
| $ | 1,228,298 |
|
| $ | 1,144,291 |
|
Borrowed funds |
| $ | 116,600 |
|
| $ | 111,000 |
|
| $ | 52,000 |
|
| $ | 50,000 |
|
| $ | 50,000 |
|
Total shareholders' equity |
| $ | 121,630 |
|
| $ | 118,566 |
|
| $ | 121,346 |
|
| $ | 124,455 |
|
| $ | 124,809 |
|
Net loans to total deposits |
|
| 99.51 | % |
|
| 99.22 | % |
|
| 90.06 | % |
|
| 88.71 | % |
|
| 87.80 | % |
Common shares outstanding |
|
| 4,434,937 |
|
|
| 4,429,357 |
|
|
| 4,459,544 |
|
|
| 4,496,701 |
|
|
| 4,569,935 |
|
QTD BALANCE SHEET AVERAGES |
|
|
|
|
|
|
|
|
|
| ||||||||||
Total assets |
| $ | 1,558,040 |
|
| $ | 1,449,874 |
|
| $ | 1,448,545 |
|
| $ | 1,353,694 |
|
| $ | 1,323,912 |
|
Earning assets |
| $ | 1,464,233 |
|
| $ | 1,360,658 |
|
| $ | 1,348,647 |
|
| $ | 1,273,650 |
|
| $ | 1,248,018 |
|
Interest bearing liabilities |
| $ | 917,888 |
|
| $ | 826,708 |
|
| $ | 831,200 |
|
| $ | 773,082 |
|
| $ | 756,545 |
|
Total shareholders' equity |
| $ | 122,695 |
|
| $ | 120,659 |
|
| $ | 118,759 |
|
| $ | 125,500 |
|
| $ | 124,720 |
|
Total tangible shareholders' equity |
| $ | 112,829 |
|
| $ | 110,686 |
|
| $ | 108,862 |
|
| $ | 121,933 |
|
| $ | 121,120 |
|
Earned common shares outstanding |
|
| 4,408,399 |
|
|
| 4,417,447 |
|
|
| 4,451,607 |
|
|
| 4,520,962 |
|
|
| 4,582,401 |
|
Unvested stock grants |
|
| 24,460 |
|
|
| 24,460 |
|
|
| 27,466 |
|
|
| 20,671 |
|
|
| 20,671 |
|
Total common shares outstanding |
|
| 4,432,859 |
|
|
| 4,441,907 |
|
|
| 4,479,073 |
|
|
| 4,541,633 |
|
|
| 4,603,072 |
|
ASSET QUALITY |
|
|
|
|
|
|
|
|
|
| ||||||||||
Nonperforming loans to gross loans(1) |
|
| 0.12 | % |
|
| 0.16 | % |
|
| 0.20 | % |
|
| 0.18 | % |
|
| 0.82 | % |
Nonperforming assets to total assets(1) |
|
| 0.12 | % |
|
| 0.16 | % |
|
| 0.19 | % |
|
| 0.17 | % |
|
| 0.63 | % |
Allowance for loan losses to gross loans(1) |
|
| 0.90 | % |
|
| 0.89 | % |
|
| 0.97 | % |
|
| 0.95 | % |
|
| 1.03 | % |
Allowance for loan losses to gross loans, net of PPP loans(1) |
|
| 0.90 | % |
|
| 0.89 | % |
|
| 0.97 | % |
|
| 0.96 | % |
|
| 1.04 | % |
Net charge-offs (recoveries) to QTD average gross loans |
|
| — | % |
|
| 0.04 | % |
|
| — | % |
|
| — | % |
|
| (0.01 | )% |
Provision for loan losses to QTD average gross loans |
|
| 0.10 | % |
|
| 0.04 | % |
|
| 0.05 | % |
|
| — | % |
|
| (0.04 | )% |
CAPITAL RATIOS(1) |
|
|
|
|
|
|
|
|
|
| ||||||||||
Total capital to risk weighted assets |
|
| 10.96 | % |
|
| 11.36 | % |
|
| 12.07 | % |
|
| 12.22 | % |
|
| 13.63 | % |
Tier 1 capital to risk weighted assets |
|
| 10.07 | % |
|
| 10.50 | % |
|
| 11.13 | % |
|
| 11.30 | % |
|
| 12.64 | % |
CET1 capital to risk weighted assets |
|
| 9.04 | % |
|
| 9.39 | % |
|
| 9.94 | % |
|
| 10.07 | % |
|
| 11.33 | % |
Tier 1 leverage ratio |
|
| 8.91 | % |
|
| 9.30 | % |
|
| 9.07 | % |
|
| 9.13 | % |
|
| 10.21 | % |
|
|
|
|
|
|
|
|
|
|
| ||||||||||
(1) At end of period |
|
|
|
|
|
|
|
|
|
| ||||||||||
|
|
|
|
|
|
|
|
|
|
| ||||||||||
The following table outlines the Corporation's YTD results of operations and provides certain performance measures as of, and for the nine months ended:
|
| 9/30/2022 |
| 9/30/2021 |
| 9/30/2020 |
| 9/30/2019 |
| 9/30/2018 | ||||||||||
INCOME STATEMENT DATA |
|
|
|
|
|
|
|
|
|
| ||||||||||
Interest income |
| $ | 41,438 |
|
| $ | 35,161 |
|
| $ | 34,355 |
|
| $ | 32,465 |
|
| $ | 26,419 |
|
Interest expense |
|
| 3,122 |
|
|
| 2,091 |
|
|
| 4,952 |
|
|
| 6,469 |
|
|
| 3,901 |
|
Net interest income |
|
| 38,316 |
|
|
| 33,070 |
|
|
| 29,403 |
|
|
| 25,996 |
|
|
| 22,518 |
|
Provision for loan losses |
|
| 2,258 |
|
|
| (218 | ) |
|
| 4,652 |
|
|
| 899 |
|
|
| 767 |
|
Noninterest income |
|
| 7,947 |
|
|
| 10,983 |
|
|
| 14,964 |
|
|
| 6,034 |
|
|
| 6,574 |
|
Noninterest expenses |
|
| 30,820 |
|
|
| 27,706 |
|
|
| 23,713 |
|
|
| 19,808 |
|
|
| 18,403 |
|
Federal income tax expense |
|
| 2,616 |
|
|
| 3,328 |
|
|
| 3,271 |
|
|
| 2,297 |
|
|
| 1,817 |
|
Net income |
| $ | 10,569 |
|
| $ | 13,237 |
|
| $ | 12,731 |
|
| $ | 9,026 |
|
| $ | 8,105 |
|
PER SHARE |
|
|
|
|
|
|
|
|
|
| ||||||||||
Earnings |
| $ | 2.39 |
|
| $ | 2.86 |
|
| $ | 2.73 |
|
| $ | 1.94 |
|
| $ | 2.23 |
|
Dividends |
| $ | 0.270 |
|
| $ | 0.240 |
|
| $ | 0.225 |
|
| $ | 0.210 |
|
| $ | 0.180 |
|
Tangible book value(1) |
| $ | 25.22 |
|
| $ | 26.53 |
|
| $ | 23.50 |
|
| $ | 20.37 |
|
| $ | 16.91 |
|
Quoted market value |
|
|
|
|
|
|
|
|
|
| ||||||||||
High |
| $ | 29.25 |
|
| $ | 27.40 |
|
| $ | 26.00 |
|
| $ | 21.00 |
|
| $ | 23.00 |
|
Low |
| $ | 23.00 |
|
| $ | 21.90 |
|
| $ | 12.55 |
|
| $ | 20.05 |
|
| $ | 18.88 |
|
Close(1) |
| $ | 23.00 |
|
| $ | 25.75 |
|
| $ | 16.93 |
|
| $ | 21.00 |
|
| $ | 21.15 |
|
PERFORMANCE RATIOS |
|
|
|
|
|
|
|
|
|
| ||||||||||
Return on average assets |
|
| 0.95 | % |
|
| 1.36 | % |
|
| 1.45 | % |
|
| 1.27 | % |
|
| 1.32 | % |
Return on average shareholders' equity |
|
| 11.71 | % |
|
| 14.55 | % |
|
| 15.79 | % |
|
| 12.73 | % |
|
| 17.29 | % |
Return on average tangible shareholders' equity |
|
| 12.75 | % |
|
| 15.00 | % |
|
| 16.40 | % |
|
| 13.35 | % |
|
| 18.77 | % |
Efficiency ratio |
|
| 66.62 | % |
|
| 62.89 | % |
|
| 53.45 | % |
|
| 61.84 | % |
|
| 63.26 | % |
Yield on earning assets (FTE) |
|
| 3.99 | % |
|
| 3.83 | % |
|
| 4.12 | % |
|
| 4.81 | % |
|
| 4.59 | % |
Rate on interest bearing liabilities |
|
| 0.49 | % |
|
| 0.37 | % |
|
| 0.93 | % |
|
| 1.43 | % |
|
| 0.98 | % |
Net interest margin to earning assets (FTE) |
|
| 3.69 | % |
|
| 3.60 | % |
|
| 3.52 | % |
|
| 3.85 | % |
|
| 3.91 | % |
BALANCE SHEET DATA(1) |
|
|
|
|
|
|
|
|
|
| ||||||||||
Total investment securities |
| $ | 129,886 |
|
| $ | 138,476 |
|
| $ | 78,179 |
|
| $ | 62,351 |
|
| $ | 79,531 |
|
Gross loans |
| $ | 1,350,851 |
|
| $ | 1,015,177 |
|
| $ | 1,060,885 |
|
| $ | 826,597 |
|
| $ | 728,302 |
|
Allowance for loan losses |
| $ | 12,200 |
|
| $ | 10,500 |
|
| $ | 10,100 |
|
| $ | 5,413 |
|
| $ | 4,146 |
|
Total assets |
| $ | 1,595,126 |
|
| $ | 1,329,300 |
|
| $ | 1,284,845 |
|
| $ | 978,046 |
|
| $ | 909,901 |
|
Total deposits |
| $ | 1,345,209 |
|
| $ | 1,144,291 |
|
| $ | 1,061,470 |
|
| $ | 801,101 |
|
| $ | 766,587 |
|
Borrowed funds |
| $ | 116,600 |
|
| $ | 50,000 |
|
| $ | 96,217 |
|
| $ | 69,000 |
|
| $ | 74,000 |
|
Total shareholders' equity |
| $ | 121,630 |
|
| $ | 124,809 |
|
| $ | 114,081 |
|
| $ | 99,142 |
|
| $ | 66,340 |
|
Net loans to total deposits |
|
| 99.51 | % |
|
| 87.80 | % |
|
| 98.99 | % |
|
| 102.51 | % |
|
| 94.46 | % |
Common shares outstanding |
|
| 4,434,937 |
|
|
| 4,569,935 |
|
|
| 4,691,142 |
|
|
| 4,658,722 |
|
|
| 3,645,402 |
|
YTD BALANCE SHEET AVERAGES |
|
|
|
|
|
|
|
|
|
| ||||||||||
Total assets | ||||||||||||||||||||
