
 Yahoo Finance
 How Fenix Resources Limited (ASX:FEX) Can Impact Your Portfolio Volatility

If you’re interested in Fenix Resources Limited (ASX:FEX), then you might want to consider its beta (a measure of share price volatility) in order to understand how the stock could impact your portfolio. Modern finance theory considers volatility to be a measure of risk, and there are two main types of price volatility. The first category is company specific volatility. This can be dealt with by limiting your exposure to any particular stock. The other type, which cannot be diversified away, is the volatility of the entire market. Every stock in the market is exposed to this volatility, which is linked to the fact that stocks prices are correlated in an efficient market.
Some stocks are more sensitive to general market forces than others. Some investors use beta as a measure of how much a certain stock is impacted by market risk (volatility). While we should keep in mind that Warren Buffett has cautioned that ‘Volatility is far from synonymous with risk’, beta is still a useful factor to consider. To make good use of it you must first know that the beta of the overall market is one. A stock with a beta below one is either less volatile than the market, or more volatile but not corellated with the overall market. In comparison a stock with a beta of over one tends to be move in a similar direction to the market in the long term, but with greater changes in price.
See our latest analysis for Fenix Resources
What we can learn from FEX’s beta value
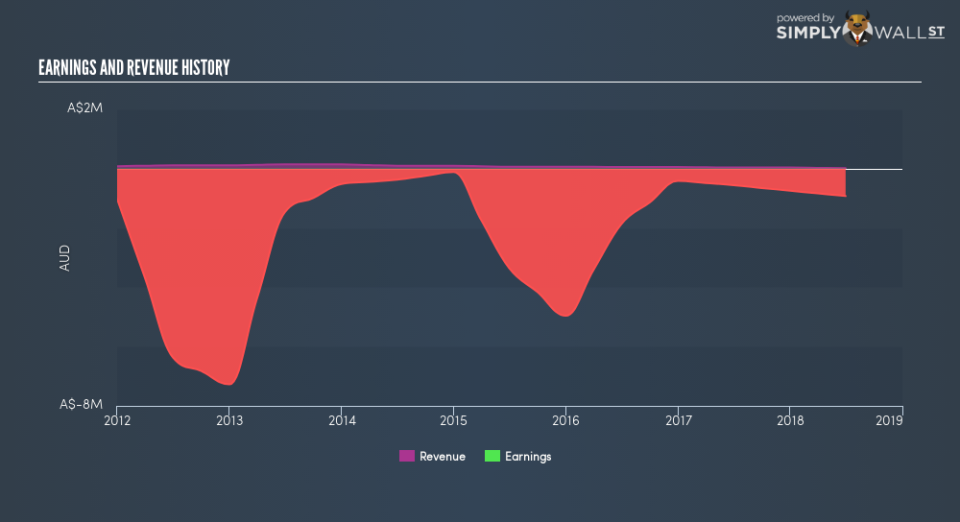
Given that it has a beta of 1.85, we can surmise that the Fenix Resources share price has been fairly sensitive to market volatility (over the last 5 years). Based on this history, investors should be aware that Fenix Resources are likely to rise strongly in times of greed, but sell off in times of fear. Many would argue that beta is useful in position sizing, but fundamental metrics such as revenue and earnings are more important overall. You can see Fenix Resources’s revenue and earnings in the image below.
Does FEX’s size influence the expected beta?
Fenix Resources is a noticeably small company, with a market capitalisation of AU$5.1m. Most companies this size are not always actively traded. It has a relatively high beta, suggesting it is fairly actively traded for a company of its size. Because it takes less capital to move the share price of a small company like this, when a stock this size is actively traded it is quite often more sensitive to market volatility than similar large companies.
What this means for you:
Beta only tells us that the Fenix Resources share price is sensitive to broader market movements. This could indicate that it is a high growth company, or is heavily influenced by sentiment because it is speculative. Alternatively, it could have operating leverage in its business model. Ultimately, beta is an interesting metric, but there’s plenty more to learn. In order to fully understand whether FEX is a good investment for you, we also need to consider important company-specific fundamentals such as Fenix Resources’s financial health and performance track record. I urge you to continue your research by taking a look at the following:
Financial Health: Are FEX’s operations financially sustainable? Balance sheets can be hard to analyze, which is why we’ve done it for you. Check out our financial health checks here.
Past Track Record: Has FEX been consistently performing well irrespective of the ups and downs in the market? Go into more detail in the past performance analysis and take a look at the free visual representations of FEX’s historicals for more clarity.
Other High-Performing Stocks: Are there other stocks that provide better prospects with proven track records? Explore our free list of these great stocks here.
To help readers see past the short term volatility of the financial market, we aim to bring you a long-term focused research analysis purely driven by fundamental data. Note that our analysis does not factor in the latest price-sensitive company announcements.
The author is an independent contributor and at the time of publication had no position in the stocks mentioned. For errors that warrant correction please contact the editor at editorial-team@simplywallst.com.
