
 Yahoo Finance
 Is Fabrinet's (NYSE:FN) Recent Stock Performance Tethered To Its Strong Fundamentals?
Fabrinet (NYSE:FN) has had a great run on the share market with its stock up by a significant 15% over the last three months. Since the market usually pay for a company’s long-term fundamentals, we decided to study the company’s key performance indicators to see if they could be influencing the market. Particularly, we will be paying attention to Fabrinet's ROE today.
Return on equity or ROE is a key measure used to assess how efficiently a company's management is utilizing the company's capital. Simply put, it is used to assess the profitability of a company in relation to its equity capital.
See our latest analysis for Fabrinet
How To Calculate Return On Equity?
ROE can be calculated by using the formula:
Return on Equity = Net Profit (from continuing operations) ÷ Shareholders' Equity
So, based on the above formula, the ROE for Fabrinet is:
17% = US$276m ÷ US$1.7b (Based on the trailing twelve months to March 2024).
The 'return' is the income the business earned over the last year. One way to conceptualize this is that for each $1 of shareholders' capital it has, the company made $0.17 in profit.
What Has ROE Got To Do With Earnings Growth?
So far, we've learned that ROE is a measure of a company's profitability. Based on how much of its profits the company chooses to reinvest or "retain", we are then able to evaluate a company's future ability to generate profits. Assuming all else is equal, companies that have both a higher return on equity and higher profit retention are usually the ones that have a higher growth rate when compared to companies that don't have the same features.
Fabrinet's Earnings Growth And 17% ROE
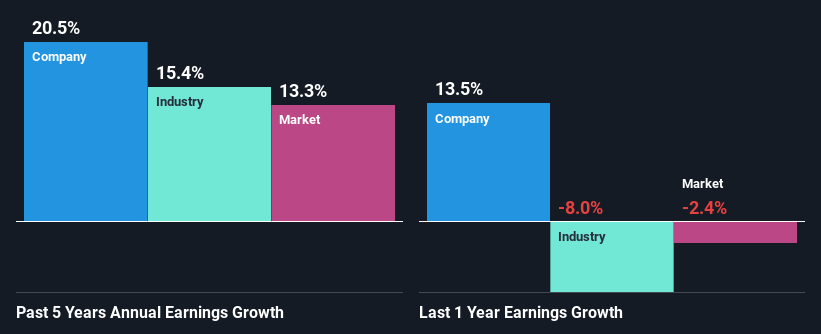
At first glance, Fabrinet seems to have a decent ROE. Especially when compared to the industry average of 9.6% the company's ROE looks pretty impressive. Probably as a result of this, Fabrinet was able to see an impressive net income growth of 20% over the last five years. We believe that there might also be other aspects that are positively influencing the company's earnings growth. For example, it is possible that the company's management has made some good strategic decisions, or that the company has a low payout ratio.
We then compared Fabrinet's net income growth with the industry and we're pleased to see that the company's growth figure is higher when compared with the industry which has a growth rate of 15% in the same 5-year period.
The basis for attaching value to a company is, to a great extent, tied to its earnings growth. It’s important for an investor to know whether the market has priced in the company's expected earnings growth (or decline). This then helps them determine if the stock is placed for a bright or bleak future. If you're wondering about Fabrinet's's valuation, check out this gauge of its price-to-earnings ratio, as compared to its industry.
Is Fabrinet Using Its Retained Earnings Effectively?
Fabrinet doesn't pay any regular dividends currently which essentially means that it has been reinvesting all of its profits into the business. This definitely contributes to the high earnings growth number that we discussed above.
Conclusion
On the whole, we feel that Fabrinet's performance has been quite good. In particular, it's great to see that the company is investing heavily into its business and along with a high rate of return, that has resulted in a sizeable growth in its earnings. The latest industry analyst forecasts show that the company is expected to maintain its current growth rate. To know more about the company's future earnings growth forecasts take a look at this free report on analyst forecasts for the company to find out more.
Have feedback on this article? Concerned about the content? Get in touch with us directly. Alternatively, email editorial-team (at) simplywallst.com.
This article by Simply Wall St is general in nature. We provide commentary based on historical data and analyst forecasts only using an unbiased methodology and our articles are not intended to be financial advice. It does not constitute a recommendation to buy or sell any stock, and does not take account of your objectives, or your financial situation. We aim to bring you long-term focused analysis driven by fundamental data. Note that our analysis may not factor in the latest price-sensitive company announcements or qualitative material. Simply Wall St has no position in any stocks mentioned.
