
 Yahoo Finance
 Exploring Top Dividend Stocks In The UK For May 2024
As the FTSE 100 shows signs of opening higher, mirroring positive movements in Asian markets, investors remain attentive to the broader economic indicators and regulatory developments within the UK. In this context, understanding what constitutes a resilient dividend stock becomes crucial, especially considering current market dynamics and economic signals such as slowing inflation and retail price adjustments.
Top 10 Dividend Stocks In The United Kingdom
Name | Dividend Yield | Dividend Rating |
Record (LSE:REC) | 7.76% | ★★★★★★ |
Keller Group (LSE:KLR) | 3.32% | ★★★★★☆ |
DCC (LSE:DCC) | 3.44% | ★★★★★☆ |
Dunelm Group (LSE:DNLM) | 7.15% | ★★★★★☆ |
Plus500 (LSE:PLUS) | 5.90% | ★★★★★☆ |
Big Yellow Group (LSE:BYG) | 3.63% | ★★★★★☆ |
Grafton Group (LSE:GFTU) | 3.52% | ★★★★★☆ |
Rio Tinto Group (LSE:RIO) | 5.85% | ★★★★★☆ |
NWF Group (AIM:NWF) | 3.87% | ★★★★★☆ |
Hargreaves Services (AIM:HSP) | 6.64% | ★★★★★☆ |
Click here to see the full list of 56 stocks from our Top Dividend Stocks screener.
We'll examine a selection from our screener results.
Epwin Group
Simply Wall St Dividend Rating: ★★★★☆☆
Overview: Epwin Group Plc is a manufacturer and distributor of building products primarily in the United Kingdom, with operations extending into the rest of Europe and internationally, boasting a market capitalization of £127.01 million.
Operations: Epwin Group Plc generates revenue through two primary segments: Extrusion and Moulding (£250.50 million) and Fabrication and Distribution (£135.20 million).
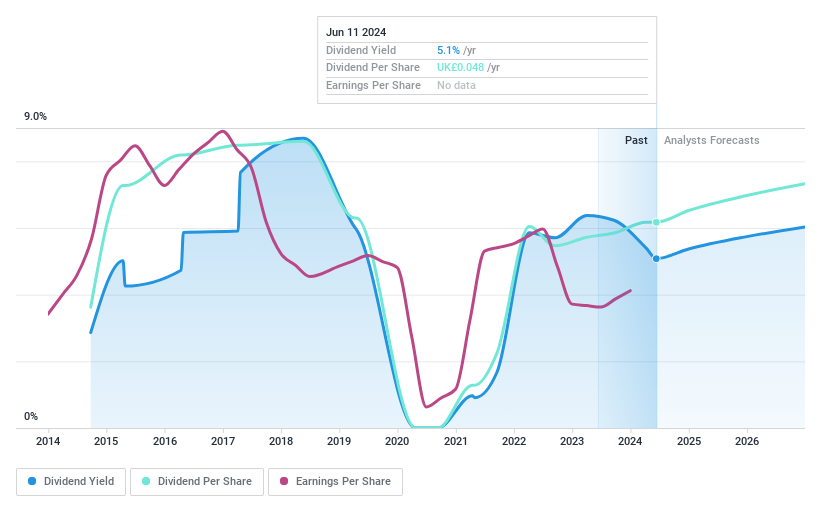
Dividend Yield: 5.4%
Epwin Group's dividend history shows volatility with fluctuations over the past decade, yet recent dividends are supported by a 74.9% payout ratio and a more stable 23.5% cash payout ratio. Despite this, Epwin’s dividend yield of 5.36% is below the top UK payers' average of 5.7%. Recent corporate activities include a share buyback and management changes, indicating potential strategic shifts but also introducing uncertainties in leadership continuity and future dividend policies.
Grafton Group
Simply Wall St Dividend Rating: ★★★★★☆
Overview: Grafton Group plc is a company involved in distribution, retailing, and manufacturing across Ireland, the Netherlands, Finland, and the United Kingdom, with a market capitalization of approximately £2.05 billion.
Operations: Grafton Group plc generates revenue through various segments, including Retailing at £258.20 million, Manufacturing at £135.30 million, UK Distribution at £818.11 million, Finland Distribution at £139.78 million, Ireland Distribution at £631.03 million, and Netherlands Distribution at £351.47 million.
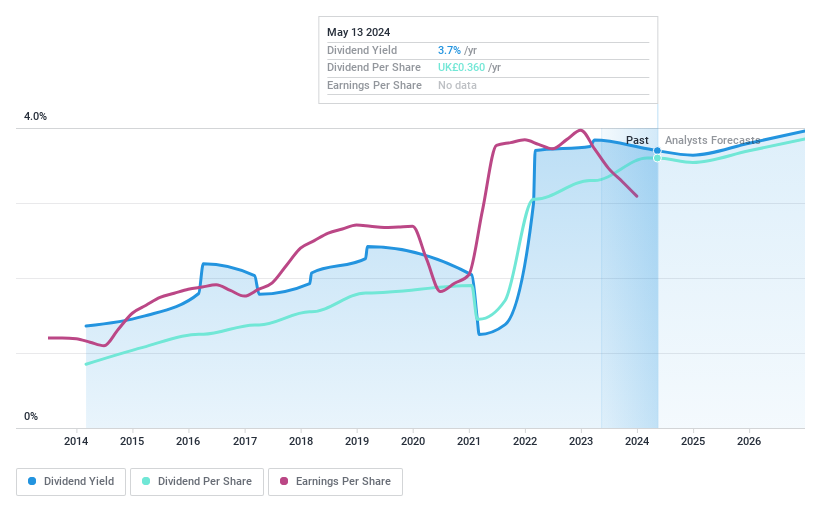
Dividend Yield: 3.5%
Grafton Group's dividend, while modest at 3.52%, is underpinned by a decade of stability and growth, supported by earnings with a payout ratio of 51.8% and cash flows with a cash payout ratio of 32.8%. Despite recent revenue declines, the firm maintains its commitment to dividends, evidenced by an increase to 26 pence per share and ongoing acquisitions aimed at expansion. The company's P/E ratio stands favorable at 13.8x against the UK market average of 17.3x, suggesting valuation attractiveness amidst strategic growth efforts through M&A activities.
Mears Group
Simply Wall St Dividend Rating: ★★★★☆☆
Overview: Mears Group plc operates in the United Kingdom, offering a range of outsourced services to both public and private sectors, with a market capitalization of approximately £377.58 million.
Operations: Mears Group plc generates its revenue primarily through Management and Maintenance services, each contributing approximately £543.35 million and £543.28 million respectively, with a smaller segment in Development at about £2.70 million.
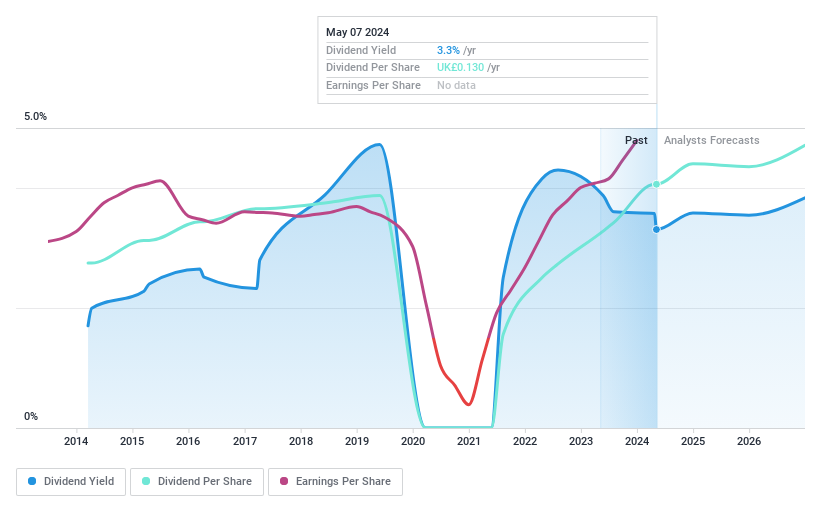
Dividend Yield: 3.3%
Mears Group's dividend sustainability is mixed. While the dividends are well-covered by both earnings and cash flows, with payout ratios of 39.5% and 11.3% respectively, the company's dividend history over the past decade has been volatile and unreliable. Despite this, Mears has increased its annual dividend to 13 pence per share for FY2023, reflecting confidence in future cash performance. However, investors should note that earnings are expected to decline annually by 7.6% over the next three years.
Dive into the specifics of Mears Group here with our thorough dividend report.
Our valuation report unveils the possibility Mears Group's shares may be trading at a discount.
Summing It All Up
Discover the full array of 56 Top Dividend Stocks right here.
Already own these companies? Bring clarity to your investment decisions by linking up your portfolio with Simply Wall St, where you can monitor all the vital signs of your stocks effortlessly.
Unlock the power of informed investing with Simply Wall St, your free guide to navigating stock markets worldwide.
Searching for a Fresh Perspective?
Explore high-performing small cap companies that haven't yet garnered significant analyst attention.
Fuel your portfolio with companies showing strong growth potential, backed by optimistic outlooks both from analysts and management.
Find companies with promising cash flow potential yet trading below their fair value.
This article by Simply Wall St is general in nature. We provide commentary based on historical data and analyst forecasts only using an unbiased methodology and our articles are not intended to be financial advice. It does not constitute a recommendation to buy or sell any stock, and does not take account of your objectives, or your financial situation. We aim to bring you long-term focused analysis driven by fundamental data. Note that our analysis may not factor in the latest price-sensitive company announcements or qualitative material. Simply Wall St has no position in any stocks mentioned.
Companies discussed in this article include AIM:EPWN LSE:GFTU and LSE:MER.
Have feedback on this article? Concerned about the content? Get in touch with us directly. Alternatively, email editorial-team@simplywallst.com
