
 Yahoo Finance
 Should You Expect Insurance Australia Group Limited (ASX:IAG) To Continue Delivering An ROE Of 15.38%?

I am writing today to help inform people who are new to the stock market and looking to gauge the potential return on investment in Insurance Australia Group Limited (ASX:IAG).
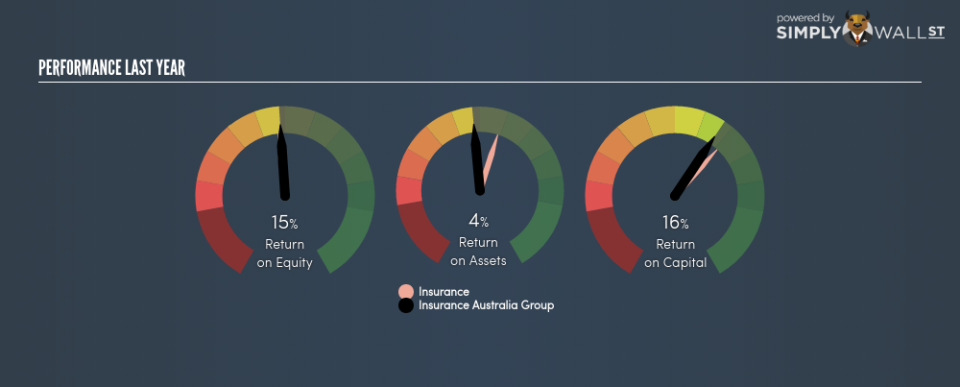
Insurance Australia Group Limited (ASX:IAG) outperformed the Property and Casualty Insurance industry on the basis of its ROE – producing a higher 15.38% relative to the peer average of 14.99% over the past 12 months. On the surface, this looks fantastic since we know that IAG has made large profits from little equity capital; however, ROE doesn’t tell us if management have borrowed heavily to make this happen. In this article, we’ll closely examine some factors like financial leverage to evaluate the sustainability of IAG’s ROE. View out our latest analysis for Insurance Australia Group
Breaking down ROE — the mother of all ratios
Return on Equity (ROE) weighs Insurance Australia Group’s profit against the level of its shareholders’ equity. An ROE of 15.38% implies A$0.15 returned on every A$1 invested. In most cases, a higher ROE is preferred; however, there are many other factors we must consider prior to making any investment decisions.
Return on Equity = Net Profit ÷ Shareholders Equity
ROE is assessed against cost of equity, which is measured using the Capital Asset Pricing Model (CAPM) – but let’s not dive into the details of that today. For now, let’s just look at the cost of equity number for Insurance Australia Group, which is 8.55%. Since Insurance Australia Group’s return covers its cost in excess of 6.83%, its use of equity capital is efficient and likely to be sustainable. Simply put, Insurance Australia Group pays less for its capital than what it generates in return. ROE can be broken down into three different ratios: net profit margin, asset turnover, and financial leverage. This is called the Dupont Formula:
Dupont Formula
ROE = profit margin × asset turnover × financial leverage
ROE = (annual net profit ÷ sales) × (sales ÷ assets) × (assets ÷ shareholders’ equity)
ROE = annual net profit ÷ shareholders’ equity
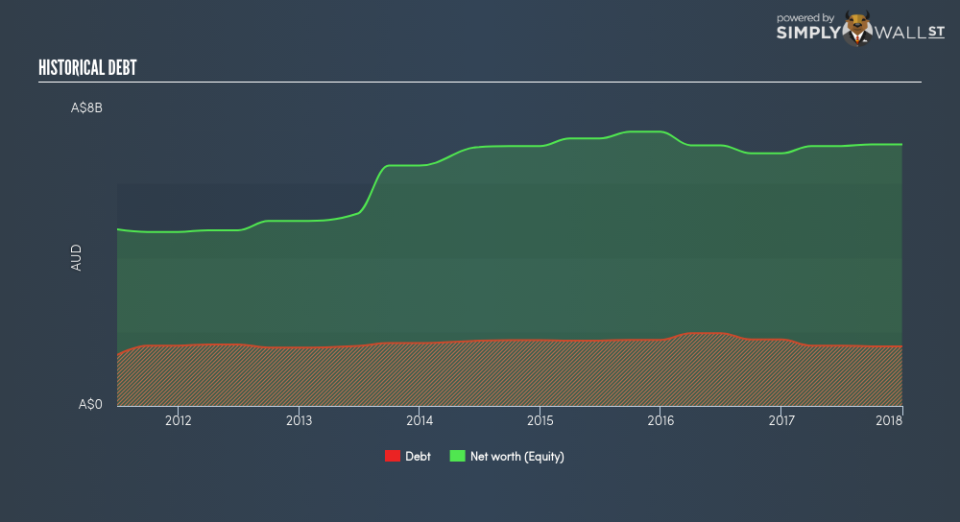
The first component is profit margin, which measures how much of sales is retained after the company pays for all its expenses. The other component, asset turnover, illustrates how much revenue Insurance Australia Group can make from its asset base. Finally, financial leverage will be our main focus today. It shows how much of assets are funded by equity and can show how sustainable the company’s capital structure is. Since ROE can be artificially increased through excessive borrowing, we should check Insurance Australia Group’s historic debt-to-equity ratio. The debt-to-equity ratio currently stands at a low 22.80%, meaning the above-average ROE is due to its capacity to produce profit growth without a huge debt burden.
Next Steps:
ROE is one of many ratios which meaningfully dissects financial statements, which illustrates the quality of a company. Insurance Australia Group’s above-industry ROE is encouraging, and is also in excess of its cost of equity. Its high ROE is not likely to be driven by high debt. Therefore, investors may have more confidence in the sustainability of this level of returns going forward. ROE is a helpful signal, but it is definitely not sufficient on its own to make an investment decision.
For Insurance Australia Group, I’ve put together three essential aspects you should look at:
Financial Health: Does it have a healthy balance sheet? Take a look at our free balance sheet analysis with six simple checks on key factors like leverage and risk.
Valuation: What is Insurance Australia Group worth today? Is the stock undervalued, even when its growth outlook is factored into its intrinsic value? The intrinsic value infographic in our free research report helps visualize whether Insurance Australia Group is currently mispriced by the market.
Other High-Growth Alternatives : Are there other high-growth stocks you could be holding instead of Insurance Australia Group? Explore our interactive list of stocks with large growth potential to get an idea of what else is out there you may be missing!
To help readers see pass the short term volatility of the financial market, we aim to bring you a long-term focused research analysis purely driven by fundamental data. Note that our analysis does not factor in the latest price sensitive company announcements.
The author is an independent contributor and at the time of publication had no position in the stocks mentioned.
