
 Yahoo Finance
 Has Excelsior Capital Limited (ASX:ECL) Been Employing Capital Shrewdly?

Today we'll look at Excelsior Capital Limited (ASX:ECL) and reflect on its potential as an investment. To be precise, we'll consider its Return On Capital Employed (ROCE), as that will inform our view of the quality of the business.
Firstly, we'll go over how we calculate ROCE. Next, we'll compare it to others in its industry. Finally, we'll look at how its current liabilities affect its ROCE.
What is Return On Capital Employed (ROCE)?
ROCE measures the 'return' (pre-tax profit) a company generates from capital employed in its business. All else being equal, a better business will have a higher ROCE. Overall, it is a valuable metric that has its flaws. Author Edwin Whiting says to be careful when comparing the ROCE of different businesses, since 'No two businesses are exactly alike.'
How Do You Calculate Return On Capital Employed?
Analysts use this formula to calculate return on capital employed:
Return on Capital Employed = Earnings Before Interest and Tax (EBIT) ÷ (Total Assets - Current Liabilities)
Or for Excelsior Capital:
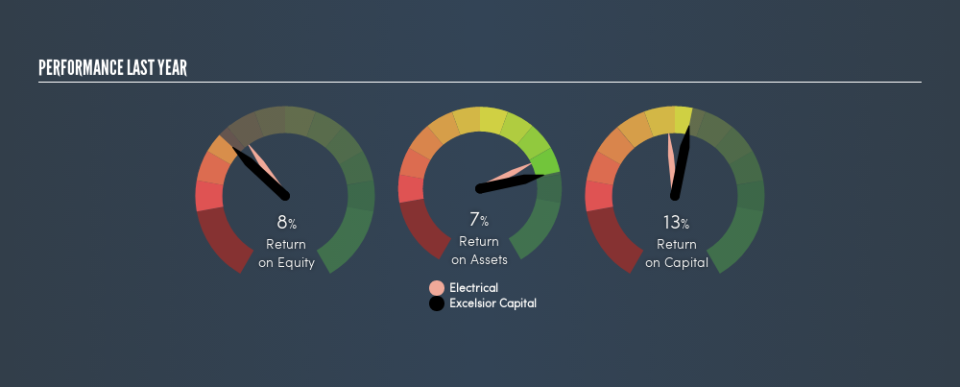
0.13 = AU$6.2m ÷ (AU$56m - AU$10.0m) (Based on the trailing twelve months to December 2018.)
So, Excelsior Capital has an ROCE of 13%.
Check out our latest analysis for Excelsior Capital
Is Excelsior Capital's ROCE Good?
When making comparisons between similar businesses, investors may find ROCE useful. We can see Excelsior Capital's ROCE is around the 12% average reported by the Electrical industry. Independently of how Excelsior Capital compares to its industry, its ROCE in absolute terms appears decent, and the company may be worthy of closer investigation.
You can see in the image below how Excelsior Capital's ROCE compares to its industry. Click to see more on past growth.
When considering this metric, keep in mind that it is backwards looking, and not necessarily predictive. ROCE can be deceptive for cyclical businesses, as returns can look incredible in boom times, and terribly low in downturns. ROCE is, after all, simply a snap shot of a single year. If Excelsior Capital is cyclical, it could make sense to check out this free graph of past earnings, revenue and cash flow.
How Excelsior Capital's Current Liabilities Impact Its ROCE
Short term (or current) liabilities, are things like supplier invoices, overdrafts, or tax bills that need to be paid within 12 months. Due to the way the ROCE equation works, having large bills due in the near term can make it look as though a company has less capital employed, and thus a higher ROCE than usual. To counter this, investors can check if a company has high current liabilities relative to total assets.
Excelsior Capital has total assets of AU$56m and current liabilities of AU$10.0m. As a result, its current liabilities are equal to approximately 18% of its total assets. Low current liabilities are not boosting the ROCE too much.
What We Can Learn From Excelsior Capital's ROCE
Overall, Excelsior Capital has a decent ROCE and could be worthy of further research. Excelsior Capital looks strong on this analysis, but there are plenty of other companies that could be a good opportunity . Here is a free list of companies growing earnings rapidly.
For those who like to find winning investments this free list of growing companies with recent insider purchasing, could be just the ticket.
We aim to bring you long-term focused research analysis driven by fundamental data. Note that our analysis may not factor in the latest price-sensitive company announcements or qualitative material.
If you spot an error that warrants correction, please contact the editor at editorial-team@simplywallst.com. This article by Simply Wall St is general in nature. It does not constitute a recommendation to buy or sell any stock, and does not take account of your objectives, or your financial situation. Simply Wall St has no position in the stocks mentioned. Thank you for reading.
