
 Yahoo Finance
 Even though Piper Sandler Companies (NYSE:PIPR) has lost US$95m market cap in last 7 days, shareholders are still up 134% over 5 years
While Piper Sandler Companies (NYSE:PIPR) shareholders are probably generally happy, the stock hasn't had particularly good run recently, with the share price falling 15% in the last quarter. But that doesn't change the fact that the returns over the last five years have been pleasing. Its return of 95% has certainly bested the market return!
In light of the stock dropping 4.6% in the past week, we want to investigate the longer term story, and see if fundamentals have been the driver of the company's positive five-year return.
Check out our latest analysis for Piper Sandler Companies
While the efficient markets hypothesis continues to be taught by some, it has been proven that markets are over-reactive dynamic systems, and investors are not always rational. One imperfect but simple way to consider how the market perception of a company has shifted is to compare the change in the earnings per share (EPS) with the share price movement.
During the five years of share price growth, Piper Sandler Companies moved from a loss to profitability. That would generally be considered a positive, so we'd expect the share price to be up. Since the company was unprofitable five years ago, but not three years ago, it's worth taking a look at the returns in the last three years, too. We can see that the Piper Sandler Companies share price is up 53% in the last three years. Meanwhile, EPS is up 49% per year. This EPS growth is higher than the 15% average annual increase in the share price over the same three years. Therefore, it seems the market has moderated its expectations for growth, somewhat. This cautious sentiment is reflected in its (fairly low) P/E ratio of 7.48.
The image below shows how EPS has tracked over time (if you click on the image you can see greater detail).
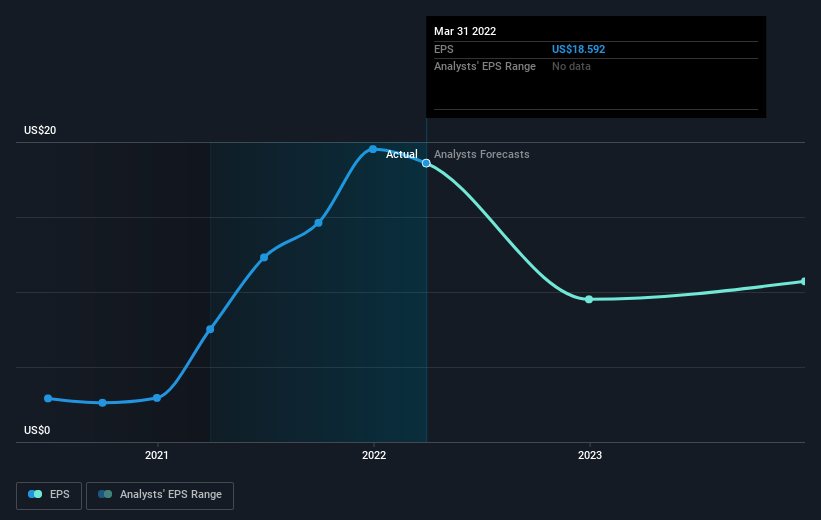
We know that Piper Sandler Companies has improved its bottom line over the last three years, but what does the future have in store? If you are thinking of buying or selling Piper Sandler Companies stock, you should check out this FREE detailed report on its balance sheet.
What About Dividends?
As well as measuring the share price return, investors should also consider the total shareholder return (TSR). The TSR is a return calculation that accounts for the value of cash dividends (assuming that any dividend received was reinvested) and the calculated value of any discounted capital raisings and spin-offs. So for companies that pay a generous dividend, the TSR is often a lot higher than the share price return. As it happens, Piper Sandler Companies' TSR for the last 5 years was 134%, which exceeds the share price return mentioned earlier. This is largely a result of its dividend payments!
A Different Perspective
While it's never nice to take a loss, Piper Sandler Companies shareholders can take comfort that , including dividends,their trailing twelve month loss of 4.3% wasn't as bad as the market loss of around 20%. Longer term investors wouldn't be so upset, since they would have made 19%, each year, over five years. In the best case scenario the last year is just a temporary blip on the journey to a brighter future. It's always interesting to track share price performance over the longer term. But to understand Piper Sandler Companies better, we need to consider many other factors. For instance, we've identified 2 warning signs for Piper Sandler Companies that you should be aware of.
Of course, you might find a fantastic investment by looking elsewhere. So take a peek at this free list of companies we expect will grow earnings.
Please note, the market returns quoted in this article reflect the market weighted average returns of stocks that currently trade on US exchanges.
Have feedback on this article? Concerned about the content? Get in touch with us directly. Alternatively, email editorial-team (at) simplywallst.com.
This article by Simply Wall St is general in nature. We provide commentary based on historical data and analyst forecasts only using an unbiased methodology and our articles are not intended to be financial advice. It does not constitute a recommendation to buy or sell any stock, and does not take account of your objectives, or your financial situation. We aim to bring you long-term focused analysis driven by fundamental data. Note that our analysis may not factor in the latest price-sensitive company announcements or qualitative material. Simply Wall St has no position in any stocks mentioned.
