
 Yahoo Finance
 Even after rising 6.4% this past week, Sarepta Therapeutics (NASDAQ:SRPT) shareholders are still down 44% over the past three years
Many investors define successful investing as beating the market average over the long term. But if you try your hand at stock picking, your risk returning less than the market. Unfortunately, that's been the case for longer term Sarepta Therapeutics, Inc. (NASDAQ:SRPT) shareholders, since the share price is down 44% in the last three years, falling well short of the market return of around 61%. The more recent news is of little comfort, with the share price down 41% in a year. On the other hand, we note it's up 9.9% in about a month.
Although the past week has been more reassuring for shareholders, they're still in the red over the last three years, so let's see if the underlying business has been responsible for the decline.
See our latest analysis for Sarepta Therapeutics
Because Sarepta Therapeutics made a loss in the last twelve months, we think the market is probably more focussed on revenue and revenue growth, at least for now. Generally speaking, companies without profits are expected to grow revenue every year, and at a good clip. As you can imagine, fast revenue growth, when maintained, often leads to fast profit growth.
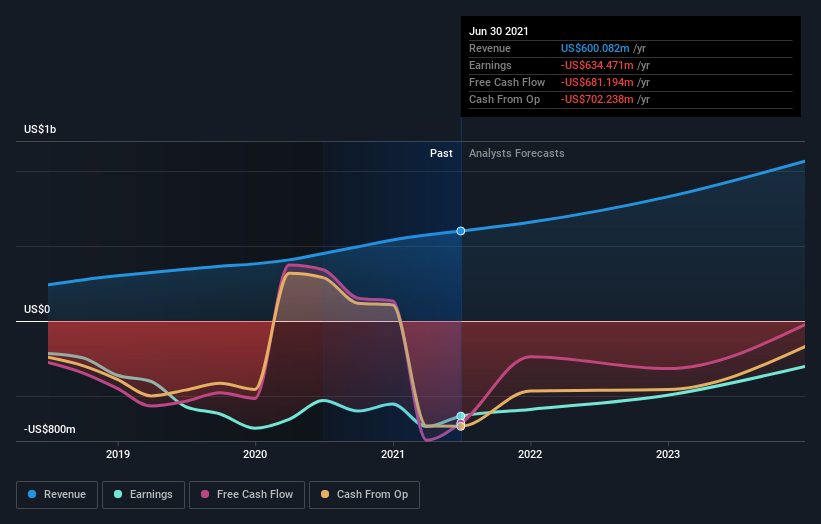
Over three years, Sarepta Therapeutics grew revenue at 29% per year. That's well above most other pre-profit companies. The share price drop of 13% per year over three years would be considered disappointing by many, so you might argue the company is getting little credit for its impressive revenue growth. It's possible that the prior share price assumed unrealistically high future growth. Before considering a purchase, investors should consider how quickly expenses are growing, relative to revenue.
The company's revenue and earnings (over time) are depicted in the image below (click to see the exact numbers).
It's probably worth noting that the CEO is paid less than the median at similar sized companies. But while CEO remuneration is always worth checking, the really important question is whether the company can grow earnings going forward. You can see what analysts are predicting for Sarepta Therapeutics in this interactive graph of future profit estimates.
A Different Perspective
While the broader market gained around 36% in the last year, Sarepta Therapeutics shareholders lost 41%. Even the share prices of good stocks drop sometimes, but we want to see improvements in the fundamental metrics of a business, before getting too interested. Longer term investors wouldn't be so upset, since they would have made 7%, each year, over five years. If the fundamental data continues to indicate long term sustainable growth, the current sell-off could be an opportunity worth considering. While it is well worth considering the different impacts that market conditions can have on the share price, there are other factors that are even more important. For example, we've discovered 1 warning sign for Sarepta Therapeutics that you should be aware of before investing here.
If you would prefer to check out another company -- one with potentially superior financials -- then do not miss this free list of companies that have proven they can grow earnings.
Please note, the market returns quoted in this article reflect the market weighted average returns of stocks that currently trade on US exchanges.
This article by Simply Wall St is general in nature. We provide commentary based on historical data and analyst forecasts only using an unbiased methodology and our articles are not intended to be financial advice. It does not constitute a recommendation to buy or sell any stock, and does not take account of your objectives, or your financial situation. We aim to bring you long-term focused analysis driven by fundamental data. Note that our analysis may not factor in the latest price-sensitive company announcements or qualitative material. Simply Wall St has no position in any stocks mentioned.
Have feedback on this article? Concerned about the content? Get in touch with us directly. Alternatively, email editorial-team (at) simplywallst.com.
