
 Yahoo Finance
 Euronet (EEFT) Up 7% Since Q1 Earnings Beat on Money Transfer Unit
Shares of Euronet Worldwide, Inc. EEFT have gained 7.4% since it reported better-than-expected first-quarter 2024 results on Apr 30. The results received an impetus from strong revenue contributions from the EFT Processing, epay and Money Transfer segments. Solid growth in cross-border transactions and sustained demand for digital products aided performance. However, the upside was partly offset by a higher level of operating costs.
EEFT reported first-quarter adjusted earnings of $1.28 per share, which surpassed the Zacks Consensus Estimate by 28%. The bottom line soared 47% year over year.
Total revenues were $857 million, which improved 9% year over year and on a constant-currency basis. The top line beat the consensus mark by 2.3%.
Euronet Worldwide, Inc. Price, Consensus and EPS Surprise
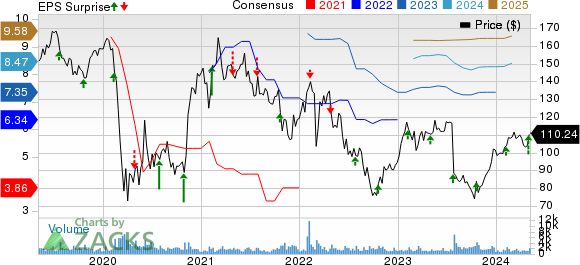
Euronet Worldwide, Inc. price-consensus-eps-surprise-chart | Euronet Worldwide, Inc. Quote
Q1 Update
EEFT’s net income climbed 32.3% year over year to $26.2 million. Operating income of $64 million advanced 40% year over year, or 45% on a constant-currency basis.
Total operating expenses escalated 6.9% year over year to $793 million due to an increase in direct operating costs, and salaries and benefits.
Adjusted EBITDA rose 17% year over year, or 19% on a constant-currency basis, to $108.8 million.
Segmental Performances
The EFT Processing segment recorded revenues of $217.2 million in the first quarter, which grew 13% year over year, or 12% on a constant-currency basis. The metric outpaced the Zacks Consensus Estimate of $202 million.
Adjusted EBITDA soared 51% year over year, or 54% on a constant-currency basis, to $44.7 million.
Operating income of $21.5 million increased more than three-fold year over year and on a constant-currency basis. Total transactions of the unit climbed 36% year over year to 2,502 million on the back of improved high-volume low-value transactions across India.
The segment’s results were aided by a growing merchant acquiring business and venturing into new markets.
The epay segment’s revenues advanced 8% year over year and on a constant-currency basis to $257.1 million, higher than the consensus mark of $255 million.
Adjusted EBITDA of $28.3 million decreased 3% year over year, or 2% on a constant-currency basis, in the first quarter.
Operating income slid 3% year over year and on a constant-currency basis to $26.6 million. Transactions in the unit were 953 million, down 2% year over year.
Expanding digital media and mobile sales contributed to the segment’s strength, partly offset by an elevated expense level resulting from inflationary challenges and growth-related business investments.
The Money Transfer segment generated revenues of $384.6 million, which advanced 7% year over year and on a constant-currency basis. The metric beat the Zacks Consensus Estimate of $382 million.
Adjusted EBITDA rose 8% year over year, or 10% on a constant-currency basis, to $44.5 million.
Operating income of $37.2 million improved 14% year over year, or 17% on a constant-currency basis. Total transactions grew 8% year over year to 40.6 million, attributable to strength in cross-border transactions and direct-to-consumer digital transactions. However, the upside was partly offset by a decline in intra-U.S. transactions.
In addition to sustained strong demand for digital products, prudent cost management efforts also contributed to the segment’s quarterly performance.
Corporate and Other expenses dipped 0.5% year over year to $21.3 million.
Financial Update (as of Mar 31, 2024)
Euronet exited the first quarter with cash and cash equivalents of $1.2 billion, which fell 1.4% from the 2023-end figure. Total assets of $5.7 billion tumbled 3.4% from the level in 2023 end.
Debt obligations, net of the current portion, amounted to $1.3 billion, which dropped 26.6% from the figure as of Dec 31, 2023. Short-term debt was $676.8 million.
Equity of $1.2 billion dipped 0.5% from the 2023-end figure.
There was roughly $579 million left under EEFT’s revolving credit facilities at the first-quarter end.
2024 Bottom-Line View Reaffirmed
Management continues to expect adjusted earnings per share (EPS) to record 10-15% year-over-year growth in 2024.
Zacks Rank
Euronet currently carries a Zacks Rank #3 (Hold). You can see the complete list of today’s Zacks #1 Rank (Strong Buy) stocks here.
Performance of Other Finance Sector Players
Here are some other Finance sector players that have reported first-quarter results so far. The bottom-line results of Virtu Financial, Inc. VIRT, American Express Company AXP and The Goldman Sachs Group, Inc. GS beat the respective Zacks Consensus Estimate.
Virtu Financial reported first-quarter 2024 adjusted EPS of 76 cents, which outpaced the Zacks Consensus Estimate by 28.8%. The bottom line advanced 2.7% year over year. Total revenues improved 3.6% year over year to $642.8 million. Adjusted net trading income slid 1.7% year over year to $366.9 million. Revenues from commissions, net and technology services amounted to $118.6 million, which slipped 2.3% year over year. Interest and dividends income of $106 million climbed 28.9% year over year.
Adjusted EBITDA of VIRT declined 2.2% to $202.8 million. Adjusted EBITDA margin of 55.3% deteriorated 30 basis points year over year. Adjusted net trading income in the Market Making segment was $273.7 million, down 1.5% year over year. The segment’s revenues rose 4.4% year over year to $521 million. The Execution Services unit recorded an adjusted net trading income of $93.2 million, which fell 2.1% year over year.
American Express’ first-quarter 2024 EPS of $3.33 beat the Zacks Consensus Estimate by 12.1%. The bottom line climbed 38.8% year over year. Total revenues net of interest expense amounted to $15.8 billion, which beat the consensus estimate by 0.3%. The top line improved 10.6% year over year. Network volumes of $419 billion rose 5% year over year.
AXP’s total interest income of $5.8 billion increased 31% year over year. Provision for credit losses escalated 20% year over year to $1.3 billion. The U.S. Consumer Services segment’s pre-tax income of $1.6 billion advanced 43% year over year. The Commercial Services segment recorded a pre-tax income of $878 million, which rose 39% year over year. The International Card Services segment reported a pre-tax income of $252 million, which rose 33% year over year.
Goldman Sachs reported first-quarter 2024 EPS of $11.58, which surpassed the Zacks Consensus Estimate of $8.54. Also, the bottom line increased 16.3% from the year-earlier quarter. Net earnings of $4.13 billion rose 27.8% from the year-ago quarter. Net revenues of $14.21 billion increased 16.3% from the year-ago quarter. Also, the top line surpassed the consensus estimate of $12.89 billion.
Provision for credit losses was $318 million against a net provision benefit of $171 million in the first quarter of 2023. The Asset & Wealth Management division of GS generated revenues of $3.79 billion, up 17.8% year over year. Firmwide assets under supervision were a record $2.85 trillion, up from $2.67 trillion reported in the prior quarter. The Global Banking & Markets division has recorded revenues of $9.73 billion, which increased 15.2% year over year.
Want the latest recommendations from Zacks Investment Research? Today, you can download 7 Best Stocks for the Next 30 Days. Click to get this free report
The Goldman Sachs Group, Inc. (GS) : Free Stock Analysis Report
American Express Company (AXP) : Free Stock Analysis Report
Euronet Worldwide, Inc. (EEFT) : Free Stock Analysis Report
Virtu Financial, Inc. (VIRT) : Free Stock Analysis Report
