
 Yahoo Finance
 EUR/USD Mid-Session Technical Analysis for September 10, 2019
The Euro is edging lower on Tuesday on below average volume as investors continue to position themselves ahead of Thursday’s European Central Bank (ECB) interest rate and monetary policy decisions. Traders still aren’t sure how to play the Euro ahead of Thursday’s ECB meeting. There is just too much to process at this time so traders are keeping their powder dry.
Two weeks ago the market was pricing in an aggressive response from the central bank, causing the single currency to plunge and the U.S. Dollar Index to spike higher. Comments from future ECB President Christine Lagarde last week and a Reuters report earlier today have caused investors to revise down their expectations.
At 11:23 GMT, the EUR/USD is trading 1.1037, down 0.0010 or -0.09%.
Daily Technical Analysis
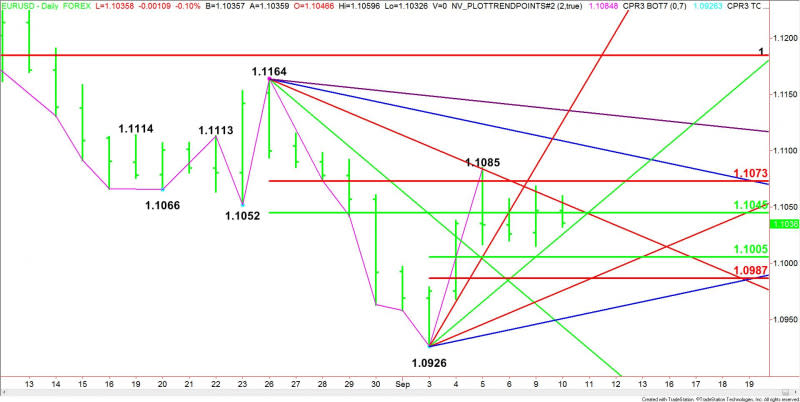
The main trend is down according to the daily swing chart. However, momentum has been trending higher since the formation of the closing price reversal bottom at 1.0926 on September 3.
A trade through 1.1164 will change the main trend to up. A move through 1.0926 will negate the closing price reversal bottom and signal a resumption of the downtrend.
The minor trend is also down, but a trade through 1.1085 will reaffirm the shift in momentum.
The main range is 1.1164 to 1.10926. The EUR/USD is currently testing its retracement zone at 1.1045 to 1.1073. This zone has been providing resistance the last four sessions. It is controlling the near-term direction of the Forex pair.
The minor range is 1.0926 to 1.1085. Its retracement zone at 1.1005 to 1.0987 is potential support.
Daily Technical Forecast
Based on the early price action and the current price at 1.1037, the direction of the EUR/USD is likely to be determined by trader reaction to a downtrending Gann angle at 1.1054 and the uptrending Gann angle at 1.1026. This angles straddle the main 50% level at 1.1045.
Bearish Scenario
A sustained move under 1.1054 and 1.1045 is a sign of weakness. Crossing to the weak side of the uptrending Gann angle at 1.1026 will indicate the selling pressure is getting stronger. This could trigger a break today into the minor retracement zone at 1.1005 to 1.0987.
Bullish Scenario
Holding above the angle at 1.1026 will indicate the presence of counter-trend buyers. Overcoming the 50% level at 1.1045 will indicate the buying is getting stronger. Overtaking the downtrending Gann angle at 1.1054 could trigger an acceleration to the upside with the next target the main Fibonacci level at 1.1073, followed by the minor top at 1.1085.
This article was originally posted on FX Empire
