
 Yahoo Finance
 EUR/USD Mid-Session Update for May 16, 2022
The Euro is trading higher against the U.S. Dollar on Monday as Euro Zone Government bonds rose back towards recent multi-year highs, after European Central Bank policymaker Francois Villeroy de Galhau said a weak Euro threatened price stability in the currency bloc.
The Euro’s weakness on currency markets could threaten the ECB’s efforts to steer inflation towards its target, Villeroy said.
At 18:15 GMT, the EUR/USD is trading 1.0423, up 0.0015 or +0.15%. The Invesco CurrencyShares Euro Trust ETF (FXE) is at $96.49, up $0.14 or +0.14%.
“Let me stress this: we will carefully monitor developments in the effective exchange rate, as a significant driver of imported inflation,” Villeroy told a conference at the Bank of France, which he also heads.
“A Euro that is too weak would go against our price stability objective.”
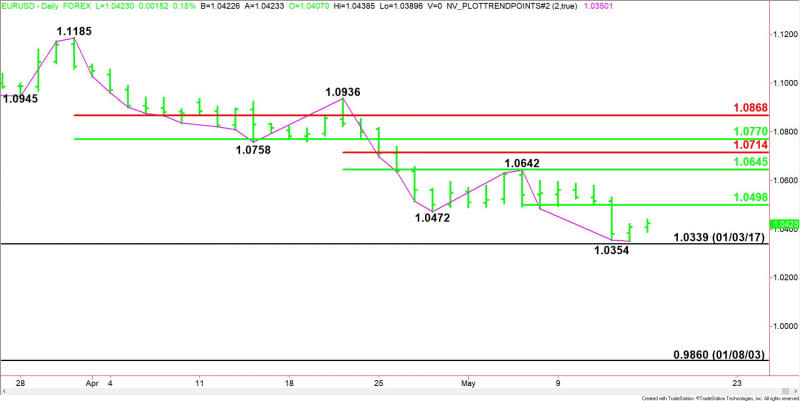
Daily Swing Chart Technical Analysis
The main trend is down according to the daily swing chart. However, momentum is trending higher following the confirmation of Friday’s closing price reversal bottom.
A trade through 1.0642 will change the main trend to up. A move through 1.0354 will negate the closing price reversal bottom and signal a resumption of the downtrend.
The minor range is 1.0642 to 1.0354. Its 50% level or pivot at 1.0498 is the nearest upside target.
The short-term range is 1.0936 to 1.0354. Its retracement zone at 1.0645 to 1.0714 is resistance.
Daily Swing Chart Technical Forecast
Trader reaction to 1.0397 will determine the direction of the EUR/USD into the close on Monday.
Bullish Scenario
A sustained move over 1.0397 will indicate the presence of buyers. Taking out the intraday high at 1.0439 will indicate the buying is getting stronger. This could trigger an intraday surge into the pivot at 1.0498.
Since the main trend is down, sellers could come in on the first test of 1.0498, but overcoming it could trigger an acceleration to the upside with the next major target a resistance cluster at 1.0642 – 1.0645.
Bearish Scenario
A sustained move under 1.0397 will signal the presence of sellers. If this creates enough downside momentum then look for the selling to possibly lead to a retest of the minor bottom at 1.0354, followed by the January 3, 2017 main bottom at 1.0339.
The main bottom at 1.0339 is very important because it is the last potential support before the January 8, 2003 main bottom at .9860.
For a look at all of today’s economic events, check out our economic calendar.
This article was originally posted on FX Empire
More From FXEMPIRE:
Tiger Global raised stakes in some tech names battered by year’s rout -filing
U.S. Rep. Liz Cheney blasts fellow Republicans after ‘great replacement’ mass shooting
Third Point’s Loeb turns back on Disney, cools on Amazon in first quarter
Australia’s James Hardie reports jump in profit on strong N.America demand
UK power group Drax submits plans for 500 million stg Scottish hydro project
