
 Yahoo Finance
 Eumundi Group Limited (ASX:EBG) Has Fared Decently But Fundamentals Look Uncertain: What Lies Ahead For The Stock?
Most readers would already know that Eumundi Group's (ASX:EBG) stock increased by 9.8% over the past three months. Given that the stock prices usually follow long-term business performance, we wonder if the company's mixed financials could have any adverse effect on its current price price movement Specifically, we decided to study Eumundi Group's ROE in this article.
ROE or return on equity is a useful tool to assess how effectively a company can generate returns on the investment it received from its shareholders. Simply put, it is used to assess the profitability of a company in relation to its equity capital.
See our latest analysis for Eumundi Group
How Do You Calculate Return On Equity?
ROE can be calculated by using the formula:
Return on Equity = Net Profit (from continuing operations) ÷ Shareholders' Equity
So, based on the above formula, the ROE for Eumundi Group is:
9.5% = AU$4.3m ÷ AU$45m (Based on the trailing twelve months to June 2021).
The 'return' is the income the business earned over the last year. That means that for every A$1 worth of shareholders' equity, the company generated A$0.10 in profit.
What Has ROE Got To Do With Earnings Growth?
So far, we've learned that ROE is a measure of a company's profitability. Based on how much of its profits the company chooses to reinvest or "retain", we are then able to evaluate a company's future ability to generate profits. Assuming everything else remains unchanged, the higher the ROE and profit retention, the higher the growth rate of a company compared to companies that don't necessarily bear these characteristics.
Eumundi Group's Earnings Growth And 9.5% ROE
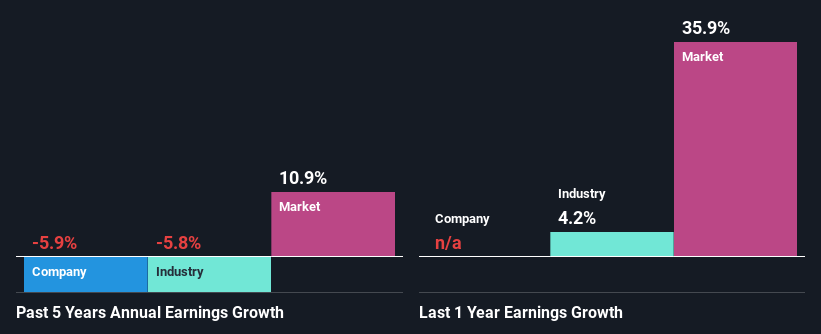
On the face of it, Eumundi Group's ROE is not much to talk about. However, given that the company's ROE is similar to the average industry ROE of 9.5%, we may spare it some thought. Having said that, Eumundi Group's five year net income decline rate was 5.9%. Remember, the company's ROE is a bit low to begin with. Hence, this goes some way in explaining the shrinking earnings.
With the industry earnings declining at a rate of 5.8% in the same period, we deduce that both the company and the industry are shrinking at the same rate.
Earnings growth is an important metric to consider when valuing a stock. The investor should try to establish if the expected growth or decline in earnings, whichever the case may be, is priced in. This then helps them determine if the stock is placed for a bright or bleak future. If you're wondering about Eumundi Group's's valuation, check out this gauge of its price-to-earnings ratio, as compared to its industry.
Is Eumundi Group Making Efficient Use Of Its Profits?
While the company did payout a portion of its dividend in the past, it currently doesn't pay a dividend. This implies that potentially all of its profits are being reinvested in the business.
Conclusion
On the whole, we feel that the performance shown by Eumundi Group can be open to many interpretations. Even though it appears to be retaining most of its profits, given the low ROE, investors may not be benefitting from all that reinvestment after all. The low earnings growth suggests our theory correct. Up till now, we've only made a short study of the company's growth data. So it may be worth checking this free detailed graph of Eumundi Group's past earnings, as well as revenue and cash flows to get a deeper insight into the company's performance.
This article by Simply Wall St is general in nature. We provide commentary based on historical data and analyst forecasts only using an unbiased methodology and our articles are not intended to be financial advice. It does not constitute a recommendation to buy or sell any stock, and does not take account of your objectives, or your financial situation. We aim to bring you long-term focused analysis driven by fundamental data. Note that our analysis may not factor in the latest price-sensitive company announcements or qualitative material. Simply Wall St has no position in any stocks mentioned.
Have feedback on this article? Concerned about the content? Get in touch with us directly. Alternatively, email editorial-team (at) simplywallst.com.
