
 Yahoo Finance
 Ethereum Price Forecast February 19, 2018, Technical Analysis
ETH/USD
Ethereum markets have gone back and forth during the trading session on Friday, essentially going nowhere. Volume is very quiet, and of course the $1000 level above is massively resistive. That’s an area that was previous support and breaking above there would be a very strong sign. However, I would need to see enough volume to go along with it to be convinced. We are a crucial levels in this market, and if we can break out to the upside with some type of volume, then I believe the overall uptrend continues. However, we still have a massive amount of resistance above, so we get a significantly negative candle with volume, that could be a selling opportunity in this market could go much lower. We are not out of the woods yet.
Get Into Ethereum Trading Today
ETH/USD Video 19.02.18

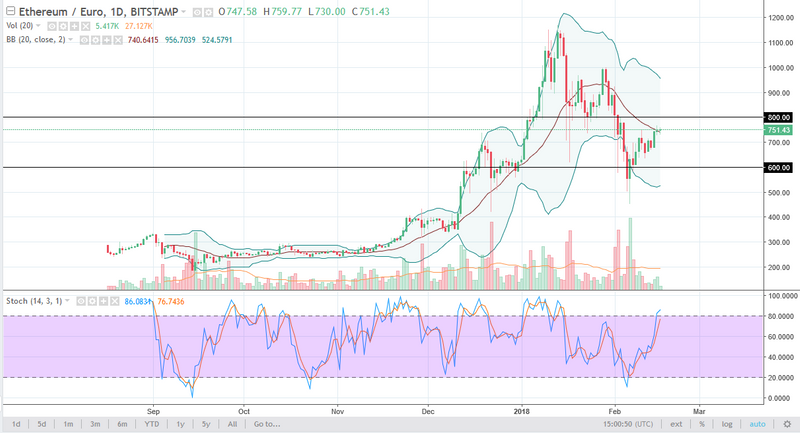
ETH/EUR
The ETH/EUR pair went sideways initially during the trading session on Thursday as well, as we drop in volume and interest. There is a lot of resistance above that extends to the €800 level, which was previous support as well. I believe that the market will more than likely roll over, especially considering that there isn’t much in the way of volume. Otherwise, if we break above the €800 level on high-volume, then I think we go towards the €1000 level. I believe that we are at the very least going to go sideways, and perhaps even pull back from there. Ultimately, if we go lower, €600 should be a supportive level. If we break down below there, the market probably goes to the €500 level. In the meantime, I think we are ready to go sideways in general.
This article was originally posted on FX Empire
