
 Yahoo Finance
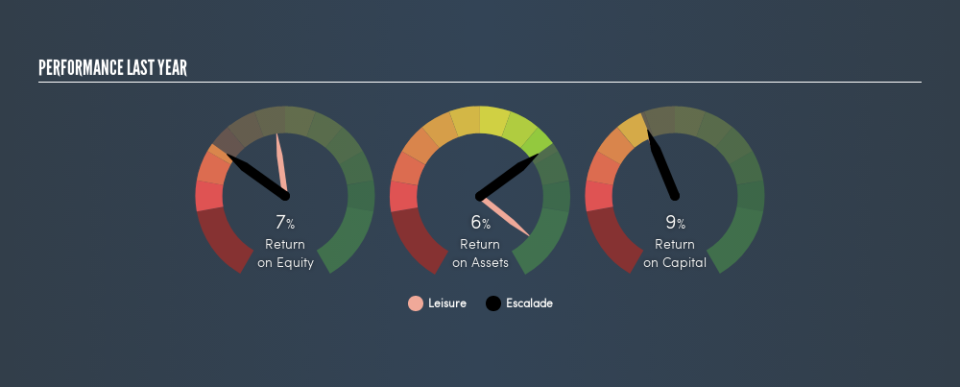
 Is Escalade, Incorporated (NASDAQ:ESCA) Struggling With Its 9.3% Return On Capital Employed?

Today we'll evaluate Escalade, Incorporated (NASDAQ:ESCA) to determine whether it could have potential as an investment idea. Specifically, we'll consider its Return On Capital Employed (ROCE), since that will give us an insight into how efficiently the business can generate profits from the capital it requires.
Firstly, we'll go over how we calculate ROCE. Then we'll compare its ROCE to similar companies. And finally, we'll look at how its current liabilities are impacting its ROCE.
What is Return On Capital Employed (ROCE)?
ROCE measures the amount of pre-tax profits a company can generate from the capital employed in its business. Generally speaking a higher ROCE is better. Ultimately, it is a useful but imperfect metric. Author Edwin Whiting says to be careful when comparing the ROCE of different businesses, since 'No two businesses are exactly alike.'
How Do You Calculate Return On Capital Employed?
Analysts use this formula to calculate return on capital employed:
Return on Capital Employed = Earnings Before Interest and Tax (EBIT) ÷ (Total Assets - Current Liabilities)
Or for Escalade:
0.093 = US$13m ÷ (US$156m - US$16m) (Based on the trailing twelve months to July 2019.)
So, Escalade has an ROCE of 9.3%.
See our latest analysis for Escalade
Does Escalade Have A Good ROCE?
ROCE is commonly used for comparing the performance of similar businesses. We can see Escalade's ROCE is meaningfully below the Leisure industry average of 17%. This performance is not ideal, as it suggests the company may not be deploying its capital as effectively as some competitors. Aside from the industry comparison, Escalade's ROCE is mediocre in absolute terms, considering the risk of investing in stocks versus the safety of a bank account. It is possible that there are more rewarding investments out there.
The image below shows how Escalade's ROCE compares to its industry, and you can click it to see more detail on its past growth.
Remember that this metric is backwards looking - it shows what has happened in the past, and does not accurately predict the future. Companies in cyclical industries can be difficult to understand using ROCE, as returns typically look high during boom times, and low during busts. This is because ROCE only looks at one year, instead of considering returns across a whole cycle. How cyclical is Escalade? You can see for yourself by looking at this free graph of past earnings, revenue and cash flow.
Do Escalade's Current Liabilities Skew Its ROCE?
Liabilities, such as supplier bills and bank overdrafts, are referred to as current liabilities if they need to be paid within 12 months. The ROCE equation subtracts current liabilities from capital employed, so a company with a lot of current liabilities appears to have less capital employed, and a higher ROCE than otherwise. To counter this, investors can check if a company has high current liabilities relative to total assets.
Escalade has total assets of US$156m and current liabilities of US$16m. As a result, its current liabilities are equal to approximately 10% of its total assets. It is good to see a restrained amount of current liabilities, as this limits the effect on ROCE.
What We Can Learn From Escalade's ROCE
That said, Escalade's ROCE is mediocre, there may be more attractive investments around. Of course, you might also be able to find a better stock than Escalade. So you may wish to see this free collection of other companies that have grown earnings strongly.
For those who like to find winning investments this free list of growing companies with recent insider purchasing, could be just the ticket.
We aim to bring you long-term focused research analysis driven by fundamental data. Note that our analysis may not factor in the latest price-sensitive company announcements or qualitative material.
If you spot an error that warrants correction, please contact the editor at editorial-team@simplywallst.com. This article by Simply Wall St is general in nature. It does not constitute a recommendation to buy or sell any stock, and does not take account of your objectives, or your financial situation. Simply Wall St has no position in the stocks mentioned. Thank you for reading.
