
 Yahoo Finance
 Equinix's (EQIX) Q1 AFFO and Revenues Beat, 2023 View Up
Equinix Inc.’s EQIX first-quarter 2023 adjusted funds from operations (AFFO) per share of $8.59 surpassed the Zacks Consensus Estimate of $7.92. The figure grew 20% from the prior-year quarter. Our AFFO per share estimate was $7.77.
EQIX’s results reflect steady growth in colocation and inter-connection revenues. During the quarter, Equinix’s total interconnections reached 452,200, rising 1% sequentially and 6% year over year. The company issued an upbeat outlook for 2023.
Total quarterly revenues came in at $2 billion, beating the Zacks Consensus Estimate of $1.98 billion. Moreover, the top line improved 15.2% year over year, marking the 81st consecutive quarter of top-line growth. Our estimate for quarterly revenues was also pegged at $1.98 billion.
Quarter in Detail
Recurring revenues were $1.89 billion, up 15.1% from the year-ago quarter. Our projection for the same was $1.9 billion. Also, non-recurring revenues grew 14.4% to $108.1 million. We estimated the same to be $83.1 million.
Revenues from the three regions increased on a year-over-year basis as well. Revenues from the Americas, EMEA and the Asia Pacific rose 10.2%, 25.6% and 10.7% to $882.4 million, $691.2 million and $424.6 million, respectively.
The adjusted EBITDA came in at $944.3 million, up 18.1%. We projected the same to be $901 million. Adjusted EBITDA margin was reported at 47%.
AFFO rose 22.9% to $801.8 million year over year.
EQIX spent $21.7 million on recurring capital expenditure in the first quarter, down 9% on a year-over-year basis. Recurring capital expenditure was 1.1% of revenues in the reported quarter. Non-recurring was $508 million, up 30.6% year over year.
Balance Sheet
Equinix had $6.6 billion of available liquidity as of Mar 31, 2023. This comprised cash, cash equivalents and its undrawn revolver and excludes restricted cash.
Its net leverage ratio was 3.4 and the weighted average maturity was 8.4 years as of Mar 31, 2023.
Dividend Update
Concurrently, Equinix’s board of directors announced a quarterly cash dividend of $3.41 per share. The increased dividend will be paid out on Jun 21, 2023, to its shareholders on record as of May 24, 2023.
Upbeat 2023 Guidance
For second-quarter 2023, Equinix projects revenues between $1.995 billion and $2.025 billion, implying a 0-1% increase over the prior quarter. The adjusted EBITDA is expected to be in the range of $881-$911 million.
For the current year, AFFO per share is now estimated between $31.15 and $32.00 (up from the prior range of $30.79-$31.64), suggesting a 5-8% increase from the prior year on an as-reported basis.
For 2023, Equinix now estimates generating total revenues of $8.175-$8.275 billion, indicating growth of 13-14% from 2022 on an as-reported basis. Earlier, the company had guided total revenues of $8.145-$8.245 billion. The company expects to incur $33 million of acquisition-related integration costs.
Management predicts an adjusted EBITDA of $3.635-$3.715 billion and an adjusted EBITDA margin of 45%.
Equinix, Inc. Price, Consensus and EPS Surprise
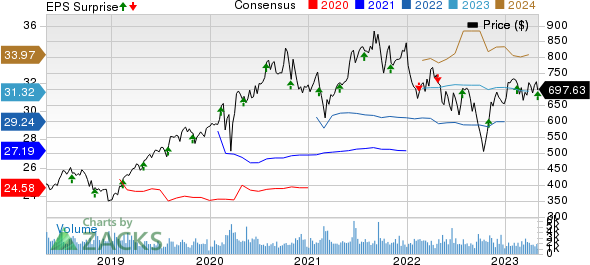
Equinix, Inc. price-consensus-eps-surprise-chart | Equinix, Inc. Quote
Equinix carries a Zacks Rank #3 (Hold) at present. You can see the complete list of today’s Zacks #1 Rank (Strong Buy) stocks here.
Performance of Other REITs
Boston Properties Inc.’s BXP first-quarter 2023 funds from operations (FFO) per share of $1.73 outpaced the Zacks Consensus Estimate of $1.70. It also surpassed our estimate of $1.68. However, the reported figure fell 4.9% year over year.
BXP’s quarterly results reflect better-than-anticipated revenues on healthy leasing activity. However, the company noted that higher interest expenses during the quarter marred its year-over-year FFO per share growth. BXP raised its outlook for 2023 FFO per share.
Highwoods Properties Inc. HIW reported first-quarter 2023 funds from operations (FFO) per share of 98 cents, surpassing the Zacks Consensus Estimate of 93 cents. The same also beat our estimate of 91 cents.
The company’s quarterly results reflect rent growth. However, a fall in occupancy and higher operating expenses acted as dampeners. HIW also revised its outlook for 2023.
Note: Anything related to earnings presented in this write-up represents FFO — a widely used metric to gauge the performance of REITs.
Want the latest recommendations from Zacks Investment Research? Today, you can download 7 Best Stocks for the Next 30 Days. Click to get this free report
Equinix, Inc. (EQIX) : Free Stock Analysis Report
Highwoods Properties, Inc. (HIW) : Free Stock Analysis Report
Boston Properties, Inc. (BXP) : Free Stock Analysis Report
