
 Yahoo Finance
 Epwin Group Plc's (LON:EPWN) On An Uptrend But Financial Prospects Look Pretty Weak: Is The Stock Overpriced?
Epwin Group's (LON:EPWN) stock is up by a considerable 13% over the past three months. However, in this article, we decided to focus on its weak fundamentals, as long-term financial performance of a business is what ultimately dictates market outcomes. Particularly, we will be paying attention to Epwin Group's ROE today.
Return on equity or ROE is a key measure used to assess how efficiently a company's management is utilizing the company's capital. In other words, it is a profitability ratio which measures the rate of return on the capital provided by the company's shareholders.
Check out our latest analysis for Epwin Group
How Do You Calculate Return On Equity?
The formula for return on equity is:
Return on Equity = Net Profit (from continuing operations) ÷ Shareholders' Equity
So, based on the above formula, the ROE for Epwin Group is:
9.1% = UK£9.3m ÷ UK£102m (Based on the trailing twelve months to December 2023).
The 'return' is the profit over the last twelve months. So, this means that for every £1 of its shareholder's investments, the company generates a profit of £0.09.
What Is The Relationship Between ROE And Earnings Growth?
So far, we've learned that ROE is a measure of a company's profitability. Depending on how much of these profits the company reinvests or "retains", and how effectively it does so, we are then able to assess a company’s earnings growth potential. Assuming everything else remains unchanged, the higher the ROE and profit retention, the higher the growth rate of a company compared to companies that don't necessarily bear these characteristics.
Epwin Group's Earnings Growth And 9.1% ROE
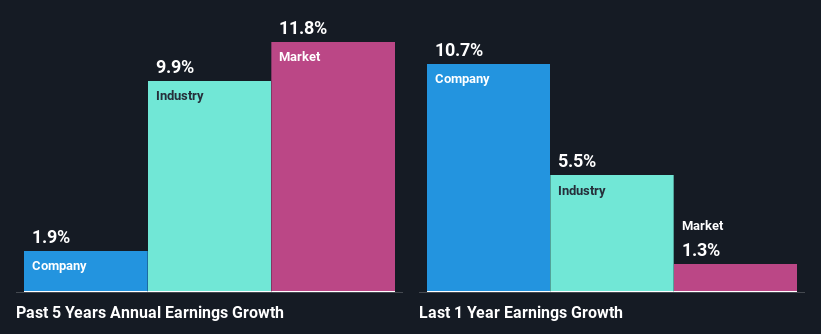
On the face of it, Epwin Group's ROE is not much to talk about. However, given that the company's ROE is similar to the average industry ROE of 9.1%, we may spare it some thought. However, Epwin Group has seen a flattish net income growth over the past five years, which is not saying much. Remember, the company's ROE is not particularly great to begin with. So that could also be one of the reasons behind the company's flat growth in earnings.
We then compared Epwin Group's net income growth with the industry and found that the company's growth figure is lower than the average industry growth rate of 9.9% in the same 5-year period, which is a bit concerning.
The basis for attaching value to a company is, to a great extent, tied to its earnings growth. What investors need to determine next is if the expected earnings growth, or the lack of it, is already built into the share price. By doing so, they will have an idea if the stock is headed into clear blue waters or if swampy waters await. Is EPWN fairly valued? This infographic on the company's intrinsic value has everything you need to know.
Is Epwin Group Using Its Retained Earnings Effectively?
With a high three-year median payout ratio of 55% (implying that the company keeps only 45% of its income) of its business to reinvest into its business), most of Epwin Group's profits are being paid to shareholders, which explains the absence of growth in earnings.
In addition, Epwin Group has been paying dividends over a period of at least ten years suggesting that keeping up dividend payments is way more important to the management even if it comes at the cost of business growth. Our latest analyst data shows that the future payout ratio of the company over the next three years is expected to be approximately 49%. However, Epwin Group's ROE is predicted to rise to 20% despite there being no anticipated change in its payout ratio.
Conclusion
On the whole, Epwin Group's performance is quite a big let-down. As a result of its low ROE and lack of much reinvestment into the business, the company has seen a disappointing earnings growth rate. Having said that, looking at the current analyst estimates, we found that the company's earnings are expected to gain momentum. To know more about the latest analysts predictions for the company, check out this visualization of analyst forecasts for the company.
Have feedback on this article? Concerned about the content? Get in touch with us directly. Alternatively, email editorial-team (at) simplywallst.com.
This article by Simply Wall St is general in nature. We provide commentary based on historical data and analyst forecasts only using an unbiased methodology and our articles are not intended to be financial advice. It does not constitute a recommendation to buy or sell any stock, and does not take account of your objectives, or your financial situation. We aim to bring you long-term focused analysis driven by fundamental data. Note that our analysis may not factor in the latest price-sensitive company announcements or qualitative material. Simply Wall St has no position in any stocks mentioned.
Have feedback on this article? Concerned about the content? Get in touch with us directly. Alternatively, email editorial-team@simplywallst.com
