
 Yahoo Finance
 Enterprise Group's (TSE:E) investors will be pleased with their fantastic 624% return over the last five years
Long term investing can be life changing when you buy and hold the truly great businesses. And we've seen some truly amazing gains over the years. Just think about the savvy investors who held Enterprise Group, Inc. (TSE:E) shares for the last five years, while they gained 624%. And this is just one example of the epic gains achieved by some long term investors. On top of that, the share price is up 40% in about a quarter. The company reported its financial results recently; you can catch up on the latest numbers by reading our company report. Anyone who held for that rewarding ride would probably be keen to talk about it.
So let's assess the underlying fundamentals over the last 5 years and see if they've moved in lock-step with shareholder returns.
See our latest analysis for Enterprise Group
There is no denying that markets are sometimes efficient, but prices do not always reflect underlying business performance. One imperfect but simple way to consider how the market perception of a company has shifted is to compare the change in the earnings per share (EPS) with the share price movement.
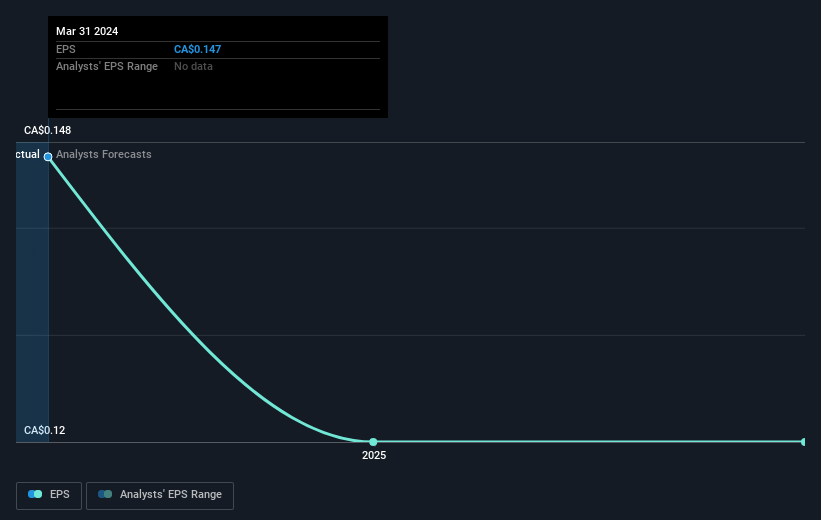
During the last half decade, Enterprise Group became profitable. Sometimes, the start of profitability is a major inflection point that can signal fast earnings growth to come, which in turn justifies very strong share price gains.
The image below shows how EPS has tracked over time (if you click on the image you can see greater detail).
It is of course excellent to see how Enterprise Group has grown profits over the years, but the future is more important for shareholders. This free interactive report on Enterprise Group's balance sheet strength is a great place to start, if you want to investigate the stock further.
A Different Perspective
It's nice to see that Enterprise Group shareholders have received a total shareholder return of 167% over the last year. That gain is better than the annual TSR over five years, which is 49%. Therefore it seems like sentiment around the company has been positive lately. In the best case scenario, this may hint at some real business momentum, implying that now could be a great time to delve deeper. I find it very interesting to look at share price over the long term as a proxy for business performance. But to truly gain insight, we need to consider other information, too. To that end, you should learn about the 3 warning signs we've spotted with Enterprise Group (including 1 which is significant) .
If you are like me, then you will not want to miss this free list of undervalued small caps that insiders are buying.
Please note, the market returns quoted in this article reflect the market weighted average returns of stocks that currently trade on Canadian exchanges.
Have feedback on this article? Concerned about the content? Get in touch with us directly. Alternatively, email editorial-team (at) simplywallst.com.
This article by Simply Wall St is general in nature. We provide commentary based on historical data and analyst forecasts only using an unbiased methodology and our articles are not intended to be financial advice. It does not constitute a recommendation to buy or sell any stock, and does not take account of your objectives, or your financial situation. We aim to bring you long-term focused analysis driven by fundamental data. Note that our analysis may not factor in the latest price-sensitive company announcements or qualitative material. Simply Wall St has no position in any stocks mentioned.
