
 Yahoo Finance
 Ensign Energy Services (TSE:ESI) Shareholders Will Want The ROCE Trajectory To Continue
If we want to find a potential multi-bagger, often there are underlying trends that can provide clues. Firstly, we'll want to see a proven return on capital employed (ROCE) that is increasing, and secondly, an expanding base of capital employed. This shows us that it's a compounding machine, able to continually reinvest its earnings back into the business and generate higher returns. So on that note, Ensign Energy Services (TSE:ESI) looks quite promising in regards to its trends of return on capital.
Understanding Return On Capital Employed (ROCE)
If you haven't worked with ROCE before, it measures the 'return' (pre-tax profit) a company generates from capital employed in its business. The formula for this calculation on Ensign Energy Services is:
Return on Capital Employed = Earnings Before Interest and Tax (EBIT) ÷ (Total Assets - Current Liabilities)
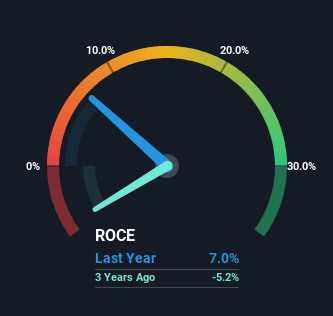
0.07 = CA$181m ÷ (CA$2.9b - CA$366m) (Based on the trailing twelve months to December 2023).
So, Ensign Energy Services has an ROCE of 7.0%. In absolute terms, that's a low return and it also under-performs the Energy Services industry average of 14%.
Check out our latest analysis for Ensign Energy Services
In the above chart we have measured Ensign Energy Services' prior ROCE against its prior performance, but the future is arguably more important. If you'd like, you can check out the forecasts from the analysts covering Ensign Energy Services for free.
What Can We Tell From Ensign Energy Services' ROCE Trend?
It's great to see that Ensign Energy Services has started to generate some pre-tax earnings from prior investments. Historically the company was generating losses but as we can see from the latest figures referenced above, they're now earning 7.0% on their capital employed. In regards to capital employed, Ensign Energy Services is using 22% less capital than it was five years ago, which on the surface, can indicate that the business has become more efficient at generating these returns. This could potentially mean that the company is selling some of its assets.
The Bottom Line
In the end, Ensign Energy Services has proven it's capital allocation skills are good with those higher returns from less amount of capital. Astute investors may have an opportunity here because the stock has declined 43% in the last five years. So researching this company further and determining whether or not these trends will continue seems justified.
One more thing, we've spotted 1 warning sign facing Ensign Energy Services that you might find interesting.
For those who like to invest in solid companies, check out this free list of companies with solid balance sheets and high returns on equity.
Have feedback on this article? Concerned about the content? Get in touch with us directly. Alternatively, email editorial-team (at) simplywallst.com.
This article by Simply Wall St is general in nature. We provide commentary based on historical data and analyst forecasts only using an unbiased methodology and our articles are not intended to be financial advice. It does not constitute a recommendation to buy or sell any stock, and does not take account of your objectives, or your financial situation. We aim to bring you long-term focused analysis driven by fundamental data. Note that our analysis may not factor in the latest price-sensitive company announcements or qualitative material. Simply Wall St has no position in any stocks mentioned.
