
 Yahoo Finance
 Is Energy Resources of Australia Ltd (ASX:ERA) Struggling With Its 2.1% Return On Capital Employed?

Today we'll look at Energy Resources of Australia Ltd (ASX:ERA) and reflect on its potential as an investment. Specifically, we'll consider its Return On Capital Employed (ROCE), since that will give us an insight into how efficiently the business can generate profits from the capital it requires.
First up, we'll look at what ROCE is and how we calculate it. Second, we'll look at its ROCE compared to similar companies. And finally, we'll look at how its current liabilities are impacting its ROCE.
Understanding Return On Capital Employed (ROCE)
ROCE is a measure of a company's yearly pre-tax profit (its return), relative to the capital employed in the business. In general, businesses with a higher ROCE are usually better quality. Ultimately, it is a useful but imperfect metric. Renowned investment researcher Michael Mauboussin has suggested that a high ROCE can indicate that 'one dollar invested in the company generates value of more than one dollar'.
So, How Do We Calculate ROCE?
The formula for calculating the return on capital employed is:
Return on Capital Employed = Earnings Before Interest and Tax (EBIT) ÷ (Total Assets - Current Liabilities)
Or for Energy Resources of Australia:
0.021 = AU$8.2m ÷ (AU$567m - AU$181m) (Based on the trailing twelve months to December 2019.)
Therefore, Energy Resources of Australia has an ROCE of 2.1%.
See our latest analysis for Energy Resources of Australia
Is Energy Resources of Australia's ROCE Good?
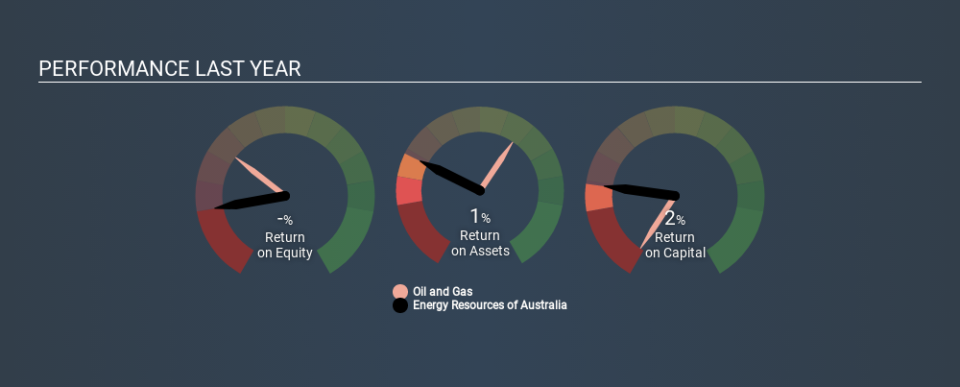
One way to assess ROCE is to compare similar companies. We can see Energy Resources of Australia's ROCE is meaningfully below the Oil and Gas industry average of 7.4%. This could be seen as a negative, as it suggests some competitors may be employing their capital more efficiently. Regardless of how Energy Resources of Australia stacks up against its industry, its ROCE in absolute terms is quite low (especially compared to a bank account). Readers may wish to look for more rewarding investments.
Energy Resources of Australia delivered an ROCE of 2.1%, which is better than 3 years ago, as was making losses back then. That implies the business has been improving. The image below shows how Energy Resources of Australia's ROCE compares to its industry, and you can click it to see more detail on its past growth.
When considering ROCE, bear in mind that it reflects the past and does not necessarily predict the future. Companies in cyclical industries can be difficult to understand using ROCE, as returns typically look high during boom times, and low during busts. This is because ROCE only looks at one year, instead of considering returns across a whole cycle. Remember that most companies like Energy Resources of Australia are cyclical businesses. Since the future is so important for investors, you should check out our free report on analyst forecasts for Energy Resources of Australia.
Energy Resources of Australia's Current Liabilities And Their Impact On Its ROCE
Short term (or current) liabilities, are things like supplier invoices, overdrafts, or tax bills that need to be paid within 12 months. Due to the way the ROCE equation works, having large bills due in the near term can make it look as though a company has less capital employed, and thus a higher ROCE than usual. To check the impact of this, we calculate if a company has high current liabilities relative to its total assets.
Energy Resources of Australia has current liabilities of AU$181m and total assets of AU$567m. Therefore its current liabilities are equivalent to approximately 32% of its total assets. With a medium level of current liabilities boosting the ROCE a little, Energy Resources of Australia's low ROCE is unappealing.
The Bottom Line On Energy Resources of Australia's ROCE
There are likely better investments out there. Of course, you might find a fantastic investment by looking at a few good candidates. So take a peek at this free list of companies with modest (or no) debt, trading on a P/E below 20.
If you like to buy stocks alongside management, then you might just love this free list of companies. (Hint: insiders have been buying them).
If you spot an error that warrants correction, please contact the editor at editorial-team@simplywallst.com. This article by Simply Wall St is general in nature. It does not constitute a recommendation to buy or sell any stock, and does not take account of your objectives, or your financial situation. Simply Wall St has no position in the stocks mentioned.
We aim to bring you long-term focused research analysis driven by fundamental data. Note that our analysis may not factor in the latest price-sensitive company announcements or qualitative material. Thank you for reading.
