
 Yahoo Finance
 Empire Energy Group (ASX:EEG) Has Gifted Shareholders With A Fantastic 203% Total Return On Their Investment
When you buy a stock there is always a possibility that it could drop 100%. But on the bright side, you can make far more than 100% on a really good stock. For example, the Empire Energy Group Limited (ASX:EEG) share price has soared 146% in the last half decade. Most would be very happy with that. And in the last week the share price has popped 7.8%.
Check out our latest analysis for Empire Energy Group
Because Empire Energy Group made a loss in the last twelve months, we think the market is probably more focussed on revenue and revenue growth, at least for now. When a company doesn't make profits, we'd generally expect to see good revenue growth. Some companies are willing to postpone profitability to grow revenue faster, but in that case one does expect good top-line growth.
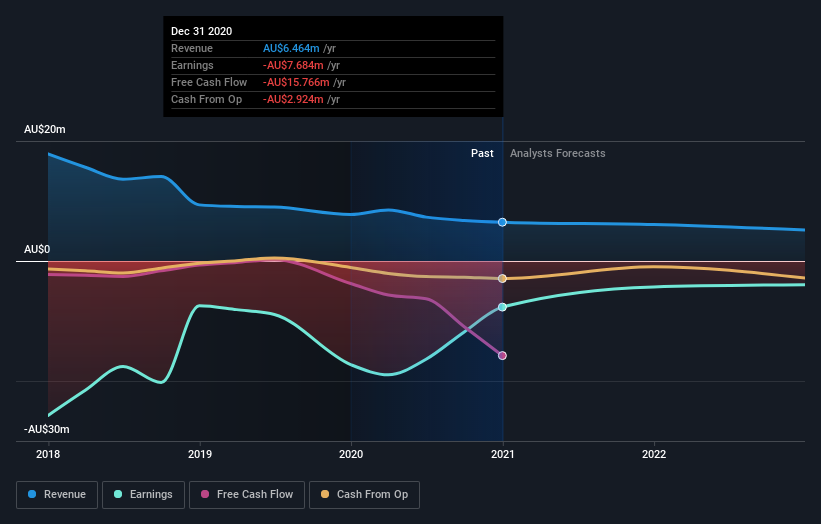
Over the last half decade Empire Energy Group's revenue has actually been trending down at about 26% per year. On the other hand, the share price done the opposite, gaining 20%, compound, each year. It's a good reminder that expectations about the future, not the past history, always impact share prices. Still, this situation makes us a little wary of the stock.
The graphic below depicts how earnings and revenue have changed over time (unveil the exact values by clicking on the image).
You can see how its balance sheet has strengthened (or weakened) over time in this free interactive graphic.
What about the Total Shareholder Return (TSR)?
We'd be remiss not to mention the difference between Empire Energy Group's total shareholder return (TSR) and its share price return. The TSR attempts to capture the value of dividends (as if they were reinvested) as well as any spin-offs or discounted capital raisings offered to shareholders. We note that Empire Energy Group's TSR, at 203% is higher than its share price return of 146%. When you consider it hasn't been paying a dividend, this data suggests shareholders have benefitted from a spin-off, or had the opportunity to acquire attractively priced shares in a discounted capital raising.
A Different Perspective
It's good to see that Empire Energy Group has rewarded shareholders with a total shareholder return of 47% in the last twelve months. Since the one-year TSR is better than the five-year TSR (the latter coming in at 25% per year), it would seem that the stock's performance has improved in recent times. In the best case scenario, this may hint at some real business momentum, implying that now could be a great time to delve deeper. While it is well worth considering the different impacts that market conditions can have on the share price, there are other factors that are even more important. For instance, we've identified 3 warning signs for Empire Energy Group that you should be aware of.
We will like Empire Energy Group better if we see some big insider buys. While we wait, check out this free list of growing companies with considerable, recent, insider buying.
Please note, the market returns quoted in this article reflect the market weighted average returns of stocks that currently trade on AU exchanges.
This article by Simply Wall St is general in nature. It does not constitute a recommendation to buy or sell any stock, and does not take account of your objectives, or your financial situation. We aim to bring you long-term focused analysis driven by fundamental data. Note that our analysis may not factor in the latest price-sensitive company announcements or qualitative material. Simply Wall St has no position in any stocks mentioned.
Have feedback on this article? Concerned about the content? Get in touch with us directly. Alternatively, email editorial-team (at) simplywallst.com.
