
 Yahoo Finance
 Embelton (ASX:EMB) Could Be At Risk Of Shrinking As A Company
What financial metrics can indicate to us that a company is maturing or even in decline? More often than not, we'll see a declining return on capital employed (ROCE) and a declining amount of capital employed. Ultimately this means that the company is earning less per dollar invested and on top of that, it's shrinking its base of capital employed. Having said that, after a brief look, Embelton (ASX:EMB) we aren't filled with optimism, but let's investigate further.
What Is Return On Capital Employed (ROCE)?
For those who don't know, ROCE is a measure of a company's yearly pre-tax profit (its return), relative to the capital employed in the business. The formula for this calculation on Embelton is:
Return on Capital Employed = Earnings Before Interest and Tax (EBIT) ÷ (Total Assets - Current Liabilities)
0.082 = AU$1.6m ÷ (AU$31m - AU$10m) (Based on the trailing twelve months to December 2023).
Therefore, Embelton has an ROCE of 8.2%. In absolute terms, that's a low return and it also under-performs the Building industry average of 11%.
Check out our latest analysis for Embelton
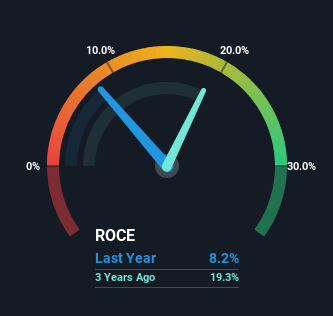
Historical performance is a great place to start when researching a stock so above you can see the gauge for Embelton's ROCE against it's prior returns. If you're interested in investigating Embelton's past further, check out this free graph covering Embelton's past earnings, revenue and cash flow.
So How Is Embelton's ROCE Trending?
There is reason to be cautious about Embelton, given the returns are trending downwards. Unfortunately the returns on capital have diminished from the 16% that they were earning five years ago. Meanwhile, capital employed in the business has stayed roughly the flat over the period. Since returns are falling and the business has the same amount of assets employed, this can suggest it's a mature business that hasn't had much growth in the last five years. So because these trends aren't typically conducive to creating a multi-bagger, we wouldn't hold our breath on Embelton becoming one if things continue as they have.
While on the subject, we noticed that the ratio of current liabilities to total assets has risen to 34%, which has impacted the ROCE. If current liabilities hadn't increased as much as they did, the ROCE could actually be even lower. While the ratio isn't currently too high, it's worth keeping an eye on this because if it gets particularly high, the business could then face some new elements of risk.
The Bottom Line On Embelton's ROCE
In summary, it's unfortunate that Embelton is generating lower returns from the same amount of capital. Investors must expect better things on the horizon though because the stock has risen 6.9% in the last five years. Regardless, we don't like the trends as they are and if they persist, we think you might find better investments elsewhere.
One final note, you should learn about the 5 warning signs we've spotted with Embelton (including 2 which are concerning) .
If you want to search for solid companies with great earnings, check out this free list of companies with good balance sheets and impressive returns on equity.
Have feedback on this article? Concerned about the content? Get in touch with us directly. Alternatively, email editorial-team (at) simplywallst.com.
This article by Simply Wall St is general in nature. We provide commentary based on historical data and analyst forecasts only using an unbiased methodology and our articles are not intended to be financial advice. It does not constitute a recommendation to buy or sell any stock, and does not take account of your objectives, or your financial situation. We aim to bring you long-term focused analysis driven by fundamental data. Note that our analysis may not factor in the latest price-sensitive company announcements or qualitative material. Simply Wall St has no position in any stocks mentioned.
