
 Yahoo Finance
 Elders Limited (ASX:ELD): Time For A Financial Health Check

Investors are always looking for growth in small-cap stocks like Elders Limited (ASX:ELD), with a market cap of AU$705m. However, an important fact which most ignore is: how financially healthy is the business? Understanding the company's financial health becomes vital, since poor capital management may bring about bankruptcies, which occur at a higher rate for small-caps. We'll look at some basic checks that can form a snapshot the company’s financial strength. Nevertheless, this is not a comprehensive overview, so I recommend you dig deeper yourself into ELD here.
Does ELD Produce Much Cash Relative To Its Debt?
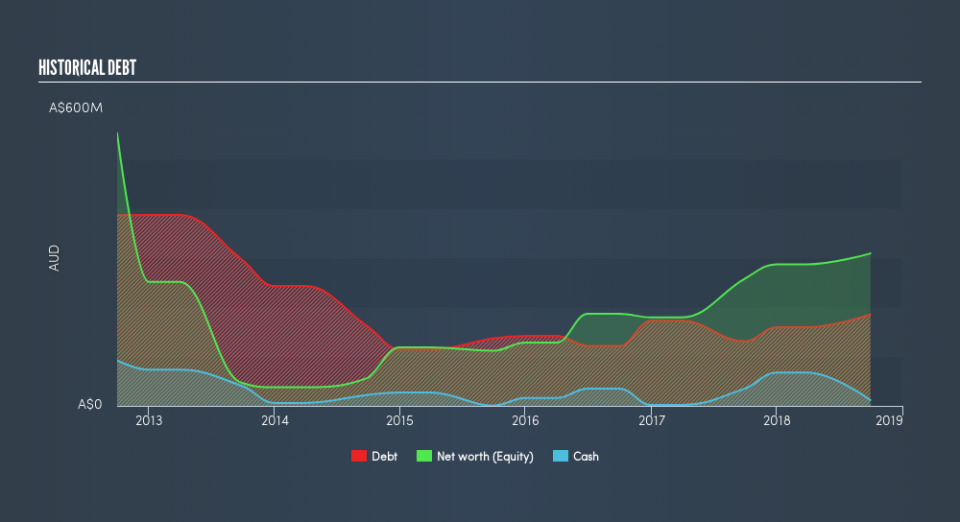
ELD's debt levels surged from AU$130m to AU$185m over the last 12 months , which is mainly comprised of near term debt. With this increase in debt, ELD's cash and short-term investments stands at AU$12m to keep the business going. We note it produced negative cash flow over the last twelve months. For this article’s sake, I won’t be looking at this today, but you can examine some of ELD’s operating efficiency ratios such as ROA here.
Can ELD meet its short-term obligations with the cash in hand?
At the current liabilities level of AU$603m, it appears that the company has been able to meet these obligations given the level of current assets of AU$640m, with a current ratio of 1.06x. The current ratio is the number you get when you divide current assets by current liabilities. Generally, for Food companies, this is a reasonable ratio as there's enough of a cash buffer without holding too much capital in low return investments.
Can ELD service its debt comfortably?
ELD is a relatively highly levered company with a debt-to-equity of 60%. This is somewhat unusual for small-caps companies, since lenders are often hesitant to provide attractive interest rates to less-established businesses. We can check to see whether ELD is able to meet its debt obligations by looking at the net interest coverage ratio. A company generating earnings before interest and tax (EBIT) at least three times its net interest payments is considered financially sound. In ELD's, case, the ratio of 11.31x suggests that interest is comfortably covered, which means that debtors may be willing to loan the company more money, giving ELD ample headroom to grow its debt facilities.
Next Steps:
ELD’s high cash coverage means that, although its debt levels are high, the company is able to utilise its borrowings efficiently in order to generate cash flow. Since there is also no concerns around ELD's liquidity needs, this may be its optimal capital structure for the time being. Keep in mind I haven't considered other factors such as how ELD has been performing in the past. I suggest you continue to research Elders to get a more holistic view of the small-cap by looking at:
Future Outlook: What are well-informed industry analysts predicting for ELD’s future growth? Take a look at our free research report of analyst consensus for ELD’s outlook.
Valuation: What is ELD worth today? Is the stock undervalued, even when its growth outlook is factored into its intrinsic value? The intrinsic value infographic in our free research report helps visualize whether ELD is currently mispriced by the market.
Other High-Performing Stocks: Are there other stocks that provide better prospects with proven track records? Explore our free list of these great stocks here.
We aim to bring you long-term focused research analysis driven by fundamental data. Note that our analysis may not factor in the latest price-sensitive company announcements or qualitative material.
If you spot an error that warrants correction, please contact the editor at editorial-team@simplywallst.com. This article by Simply Wall St is general in nature. It does not constitute a recommendation to buy or sell any stock, and does not take account of your objectives, or your financial situation. Simply Wall St has no position in the stocks mentioned. Thank you for reading.
