
 Yahoo Finance
 Is Elanor Investors Group’s (ASX:ENN) Balance Sheet Strong Enough To Weather A Storm?

While small-cap stocks, such as Elanor Investors Group (ASX:ENN) with its market cap of AU$178.04m, are popular for their explosive growth, investors should also be aware of their balance sheet to judge whether the company can survive a downturn. Given that ENN is not presently profitable, it’s crucial to assess the current state of its operations and pathway to profitability. I believe these basic checks tell most of the story you need to know. Nevertheless, given that I have not delve into the company-specifics, I recommend you dig deeper yourself into ENN here.
How does ENN’s operating cash flow stack up against its debt?
ENN has built up its total debt levels in the last twelve months, from AU$62.07m to AU$0 – this includes both the current and long-term debt. With this rise in debt, the current cash and short-term investment levels stands at AU$15.73m , ready to deploy into the business. Moreover, ENN has generated AU$12.77m in operating cash flow over the same time period, resulting in an operating cash to total debt ratio of 18.61%, indicating that ENN’s debt is not appropriately covered by operating cash. This ratio can also be a sign of operational efficiency for unprofitable businesses as traditional metrics such as return on asset (ROA) requires a positive net income. In ENN’s case, it is able to generate 0.19x cash from its debt capital.
Can ENN meet its short-term obligations with the cash in hand?
Looking at ENN’s most recent AU$12.35m liabilities, the company has been able to meet these commitments with a current assets level of AU$32.28m, leading to a 2.61x current account ratio. For Hospitality companies, this ratio is within a sensible range as there’s enough of a cash buffer without holding too capital in low return investments.
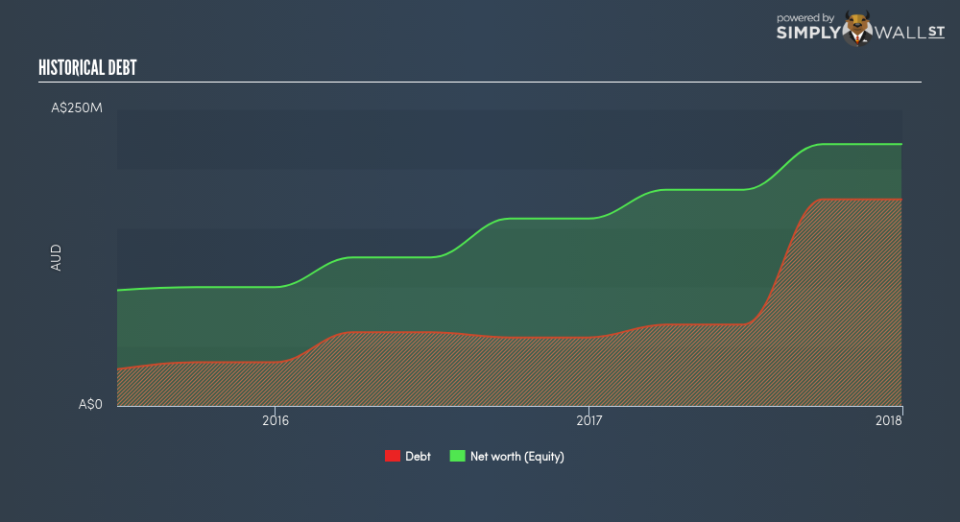
Does ENN face the risk of succumbing to its debt-load?
With debt reaching 78.86% of equity, ENN may be thought of as relatively highly levered. This is not uncommon for a small-cap company given that debt tends to be lower-cost and at times, more accessible. Though, since ENN is currently loss-making, sustainability of its current state of operations becomes a concern. Maintaining a high level of debt, while revenues are still below costs, can be dangerous as liquidity tends to dry up in unexpected downturns.
Next Steps:
ENN’s debt and cash flow levels indicate room for improvement. Its cash flow coverage of less than a quarter of debt means that operating efficiency could be an issue. However, the company exhibits proper management of current assets and upcoming liabilities. I admit this is a fairly basic analysis for ENN’s financial health. Other important fundamentals need to be considered alongside. You should continue to research Elanor Investors Group to get a better picture of the stock by looking at:
Future Outlook: What are well-informed industry analysts predicting for ENN’s future growth? Take a look at our free research report of analyst consensus for ENN’s outlook.
Historical Performance: What has ENN’s returns been like over the past? Go into more detail in the past track record analysis and take a look at the free visual representations of our analysis for more clarity.
Other High-Performing Stocks: Are there other stocks that provide better prospects with proven track records? Explore our free list of these great stocks here.
To help readers see pass the short term volatility of the financial market, we aim to bring you a long-term focused research analysis purely driven by fundamental data. Note that our analysis does not factor in the latest price sensitive company announcements.
The author is an independent contributor and at the time of publication had no position in the stocks mentioned.
