
 Yahoo Finance
 EKF Diagnostics Holdings (LON:EKF) investors are sitting on a loss of 51% if they invested three years ago
If you are building a properly diversified stock portfolio, the chances are some of your picks will perform badly. But the long term shareholders of EKF Diagnostics Holdings plc (LON:EKF) have had an unfortunate run in the last three years. Sadly for them, the share price is down 55% in that time.
It's worthwhile assessing if the company's economics have been moving in lockstep with these underwhelming shareholder returns, or if there is some disparity between the two. So let's do just that.
View our latest analysis for EKF Diagnostics Holdings
In his essay The Superinvestors of Graham-and-Doddsville Warren Buffett described how share prices do not always rationally reflect the value of a business. By comparing earnings per share (EPS) and share price changes over time, we can get a feel for how investor attitudes to a company have morphed over time.
During five years of share price growth, EKF Diagnostics Holdings moved from a loss to profitability. We would usually expect to see the share price rise as a result. So given the share price is down it's worth checking some other metrics too.
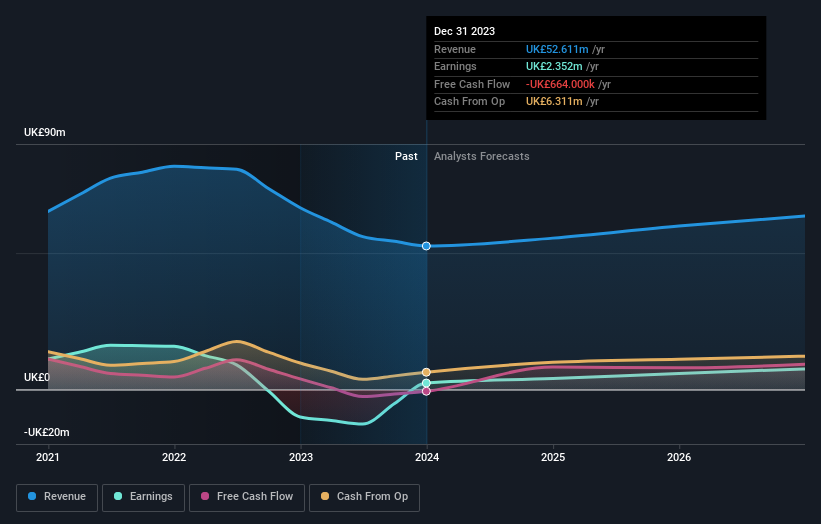
We note that the dividend seems healthy enough, so that probably doesn't explain the share price drop. However, the weak share price might be related to the fact revenue has been disappearing at a rate of 11% each year, over three years. This could have some investors worried about the longer term growth potential (or lack thereof).
The graphic below depicts how earnings and revenue have changed over time (unveil the exact values by clicking on the image).
We know that EKF Diagnostics Holdings has improved its bottom line lately, but what does the future have in store? You can see what analysts are predicting for EKF Diagnostics Holdings in this interactive graph of future profit estimates.
What About Dividends?
When looking at investment returns, it is important to consider the difference between total shareholder return (TSR) and share price return. The TSR incorporates the value of any spin-offs or discounted capital raisings, along with any dividends, based on the assumption that the dividends are reinvested. It's fair to say that the TSR gives a more complete picture for stocks that pay a dividend. In the case of EKF Diagnostics Holdings, it has a TSR of -51% for the last 3 years. That exceeds its share price return that we previously mentioned. The dividends paid by the company have thusly boosted the total shareholder return.
A Different Perspective
We're pleased to report that EKF Diagnostics Holdings shareholders have received a total shareholder return of 20% over one year. And that does include the dividend. That gain is better than the annual TSR over five years, which is 0.2%. Therefore it seems like sentiment around the company has been positive lately. In the best case scenario, this may hint at some real business momentum, implying that now could be a great time to delve deeper. It's always interesting to track share price performance over the longer term. But to understand EKF Diagnostics Holdings better, we need to consider many other factors. Even so, be aware that EKF Diagnostics Holdings is showing 3 warning signs in our investment analysis , and 1 of those is concerning...
We will like EKF Diagnostics Holdings better if we see some big insider buys. While we wait, check out this free list of growing companies with considerable, recent, insider buying.
Please note, the market returns quoted in this article reflect the market weighted average returns of stocks that currently trade on British exchanges.
Have feedback on this article? Concerned about the content? Get in touch with us directly. Alternatively, email editorial-team (at) simplywallst.com.
This article by Simply Wall St is general in nature. We provide commentary based on historical data and analyst forecasts only using an unbiased methodology and our articles are not intended to be financial advice. It does not constitute a recommendation to buy or sell any stock, and does not take account of your objectives, or your financial situation. We aim to bring you long-term focused analysis driven by fundamental data. Note that our analysis may not factor in the latest price-sensitive company announcements or qualitative material. Simply Wall St has no position in any stocks mentioned.
