
 Yahoo Finance
 eEnergy Group (LON:EAAS) investors are sitting on a loss of 55% if they invested a year ago
The nature of investing is that you win some, and you lose some. Unfortunately, shareholders of eEnergy Group Plc (LON:EAAS) have suffered share price declines over the last year. To wit the share price is down 55% in that time. eEnergy Group may have better days ahead, of course; we've only looked at a one year period. Furthermore, it's down 26% in about a quarter. That's not much fun for holders.
Now let's have a look at the company's fundamentals, and see if the long term shareholder return has matched the performance of the underlying business.
View our latest analysis for eEnergy Group
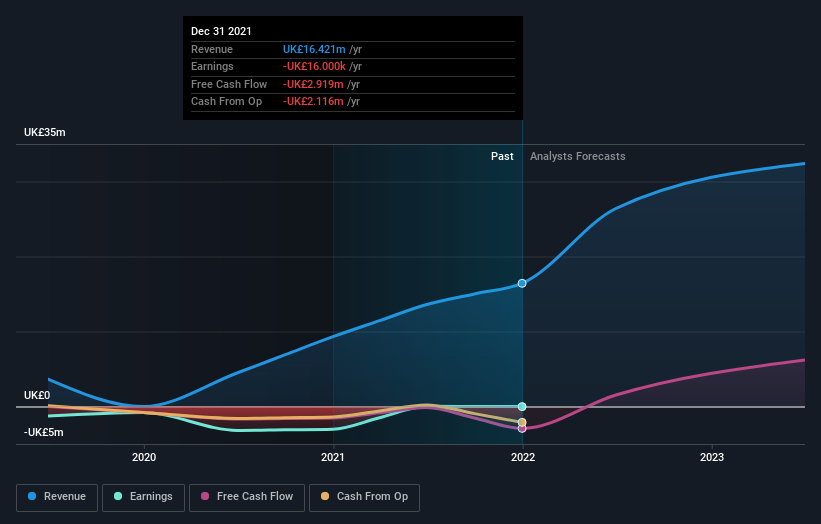
eEnergy Group isn't currently profitable, so most analysts would look to revenue growth to get an idea of how fast the underlying business is growing. Shareholders of unprofitable companies usually expect strong revenue growth. As you can imagine, fast revenue growth, when maintained, often leads to fast profit growth.
In the last twelve months, eEnergy Group increased its revenue by 76%. That's a strong result which is better than most other loss making companies. In contrast the share price is down 55% over twelve months. Yes, the market can be a fickle mistress. This could mean hype has come out of the stock because the bottom line is concerning investors. Generally speaking investors would consider a stock like this less risky once it turns a profit. But when do you think that will happen?
The company's revenue and earnings (over time) are depicted in the image below (click to see the exact numbers).
We like that insiders have been buying shares in the last twelve months. Even so, future earnings will be far more important to whether current shareholders make money. You can see what analysts are predicting for eEnergy Group in this interactive graph of future profit estimates.
A Different Perspective
While eEnergy Group shareholders are down 55% for the year, the market itself is up 4.5%. However, keep in mind that even the best stocks will sometimes underperform the market over a twelve month period. With the stock down 26% over the last three months, the market doesn't seem to believe that the company has solved all its problems. Given the relatively short history of this stock, we'd remain pretty wary until we see some strong business performance. I find it very interesting to look at share price over the long term as a proxy for business performance. But to truly gain insight, we need to consider other information, too. For instance, we've identified 4 warning signs for eEnergy Group that you should be aware of.
eEnergy Group is not the only stock that insiders are buying. For those who like to find winning investments this free list of growing companies with recent insider purchasing, could be just the ticket.
Please note, the market returns quoted in this article reflect the market weighted average returns of stocks that currently trade on GB exchanges.
Have feedback on this article? Concerned about the content? Get in touch with us directly. Alternatively, email editorial-team (at) simplywallst.com.
This article by Simply Wall St is general in nature. We provide commentary based on historical data and analyst forecasts only using an unbiased methodology and our articles are not intended to be financial advice. It does not constitute a recommendation to buy or sell any stock, and does not take account of your objectives, or your financial situation. We aim to bring you long-term focused analysis driven by fundamental data. Note that our analysis may not factor in the latest price-sensitive company announcements or qualitative material. Simply Wall St has no position in any stocks mentioned.
