
 Yahoo Finance
 Edison International (EIX) Q3 Earnings Lag, Revenues Down Y/Y
Edison International EIX reported third-quarter 2019 adjusted earnings of $1.49 per share, which missed the Zacks Consensus Estimate of $1.53 by 2.6%. The bottom line deteriorated from the year-ago quarter earnings of $1.56.
Excluding adjustments, quarterly earnings came in at $1.35 per share from continuing operations compared with $1.57 in third-quarter 2018.
The year-over-year bottom-line decline can be attributed to lower revenues as well as operating income.
Total Revenues
Edison International's third-quarter revenues totaled $3.74 billion, which missed the Zacks Consensus Estimate of $4.28 billion by 12.7%. Also, the top line declined 12.4% from the year-ago quarter’s figure of $4.27 billion.
Edison International Price, Consensus and EPS Surprise
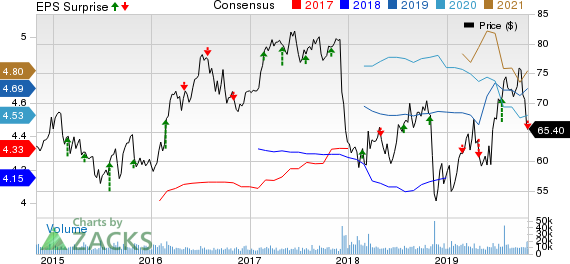
Edison International price-consensus-eps-surprise-chart | Edison International Quote
Segment Results
Southern California Edison’s (SCE) third-quarter adjusted earnings came in at $1.59 per share compared with $1.62 a year ago. The downside can be primarily attributed to increase in shares outstanding related to the equity offering in July 2019 and higher wildfire mitigation expenses.
The Parent and Other segment incurred an adjusted loss of 9 cents per share in the quarter under review compared with the year-ago quarter’s loss of 6 cents. The wider core loss was mainly due to higher interest expense as a result of increased borrowings.
Financial Update
As of Sep 30, 2019, Edison International's cash and cash equivalents amounted to $547 million compared with $144 million as of Dec 31, 2018. Long-term debt was $17.07 billion, higher than the 2018-end level of $14.63 billion.
Net cash outflow from operating activities during the first nine months of 2019 was $817 million against cash inflow of $2,271 million in the prior-year period. Total capital expenditures totaled $3,497 million at the end of the third quarter, up from $3,241 million a year ago.
Zacks Rank
Edison International currently carries a Zacks Rank #3 (Hold). You can see the complete list of today’s Zacks #1 Rank (Strong Buy) stocks here.
Recent Utility Releases
NextEra Energy NEE reported third-quarter 2019 adjusted earnings of $2.39 per share, beating the Zacks Consensus Estimate of $2.27 by 5.3%. Moreover, earnings were up 10.1% on a year-over-year basis.
Xcel Energy XEL posted third-quarter 2019 operating earnings of $1.01 per share, which lagged the Zacks Consensus Estimate of $1.05 by 3.8%. The bottom line increased 5.2% from the year-ago quarter.
American Electric Power AEP reported third-quarter 2019 adjusted earnings per share of $1.46, which surpassed the Zacks Consensus Estimate of $1.30 by 12.3%.
Today's Best Stocks from Zacks
Would you like to see the updated picks from our best market-beating strategies? From 2017 through 2018, while the S&P 500 gained +15.8%, five of our screens returned +38.0%, +61.3%, +61.6%, +68.1%, and +98.3%.
This outperformance has not just been a recent phenomenon. From 2000 – 2018, while the S&P averaged +4.8% per year, our top strategies averaged up to +56.2% per year.
See their latest picks free >>
Want the latest recommendations from Zacks Investment Research? Today, you can download 7 Best Stocks for the Next 30 Days. Click to get this free report
American Electric Power Company, Inc. (AEP) : Free Stock Analysis Report
NextEra Energy, Inc. (NEE) : Free Stock Analysis Report
Xcel Energy Inc. (XEL) : Free Stock Analysis Report
Edison International (EIX) : Free Stock Analysis Report
To read this article on Zacks.com click here.
Zacks Investment Research
