
 Yahoo Finance
 Ebix (NASDAQ:EBIX) sheds US$54m, company earnings and investor returns have been trending downwards for past five years
Ebix, Inc. (NASDAQ:EBIX) shareholders should be happy to see the share price up 23% in the last month. But spare a thought for the long term holders, who have held the stock as it bled value over the last five years. Indeed, the share price is down a whopping 80% in that time. The recent bounce might mean the long decline is over, but we are not confident. The million dollar question is whether the company can justify a long term recovery.
Since Ebix has shed US$54m from its value in the past 7 days, let's see if the longer term decline has been driven by the business' economics.
See our latest analysis for Ebix
There is no denying that markets are sometimes efficient, but prices do not always reflect underlying business performance. One imperfect but simple way to consider how the market perception of a company has shifted is to compare the change in the earnings per share (EPS) with the share price movement.
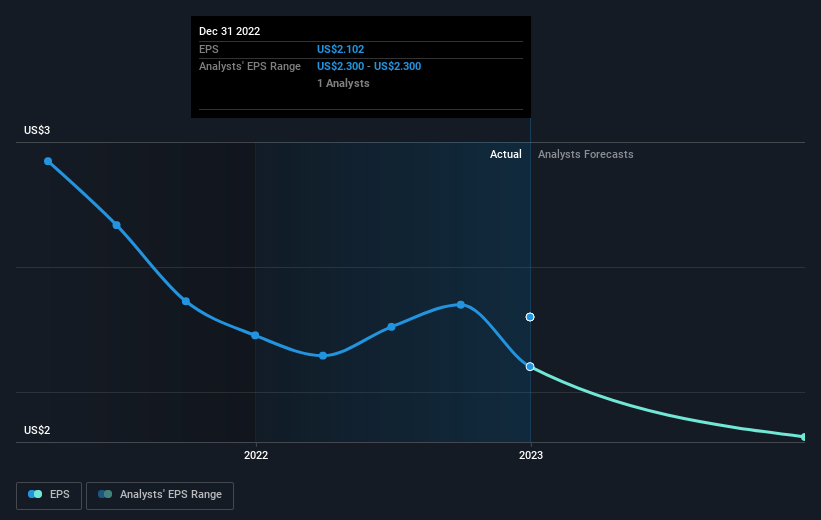
During the five years over which the share price declined, Ebix's earnings per share (EPS) dropped by 8.1% each year. This reduction in EPS is less than the 27% annual reduction in the share price. This implies that the market is more cautious about the business these days. The low P/E ratio of 7.58 further reflects this reticence.
You can see how EPS has changed over time in the image below (click on the chart to see the exact values).
This free interactive report on Ebix's earnings, revenue and cash flow is a great place to start, if you want to investigate the stock further.
A Different Perspective
While the broader market lost about 3.1% in the twelve months, Ebix shareholders did even worse, losing 46% (even including dividends). However, it could simply be that the share price has been impacted by broader market jitters. It might be worth keeping an eye on the fundamentals, in case there's a good opportunity. Regrettably, last year's performance caps off a bad run, with the shareholders facing a total loss of 12% per year over five years. We realise that Baron Rothschild has said investors should "buy when there is blood on the streets", but we caution that investors should first be sure they are buying a high quality business. It's always interesting to track share price performance over the longer term. But to understand Ebix better, we need to consider many other factors. Even so, be aware that Ebix is showing 4 warning signs in our investment analysis , and 2 of those are concerning...
But note: Ebix may not be the best stock to buy. So take a peek at this free list of interesting companies with past earnings growth (and further growth forecast).
Please note, the market returns quoted in this article reflect the market weighted average returns of stocks that currently trade on American exchanges.
Have feedback on this article? Concerned about the content? Get in touch with us directly. Alternatively, email editorial-team (at) simplywallst.com.
This article by Simply Wall St is general in nature. We provide commentary based on historical data and analyst forecasts only using an unbiased methodology and our articles are not intended to be financial advice. It does not constitute a recommendation to buy or sell any stock, and does not take account of your objectives, or your financial situation. We aim to bring you long-term focused analysis driven by fundamental data. Note that our analysis may not factor in the latest price-sensitive company announcements or qualitative material. Simply Wall St has no position in any stocks mentioned.
Join A Paid User Research Session
You’ll receive a US$30 Amazon Gift card for 1 hour of your time while helping us build better investing tools for the individual investors like yourself. Sign up here
