
 Yahoo Finance
 Ebiquity (LON:EBQ) Hasn't Managed To Accelerate Its Returns
If you're not sure where to start when looking for the next multi-bagger, there are a few key trends you should keep an eye out for. Firstly, we'd want to identify a growing return on capital employed (ROCE) and then alongside that, an ever-increasing base of capital employed. Basically this means that a company has profitable initiatives that it can continue to reinvest in, which is a trait of a compounding machine. However, after briefly looking over the numbers, we don't think Ebiquity (LON:EBQ) has the makings of a multi-bagger going forward, but let's have a look at why that may be.
What Is Return On Capital Employed (ROCE)?
For those who don't know, ROCE is a measure of a company's yearly pre-tax profit (its return), relative to the capital employed in the business. To calculate this metric for Ebiquity, this is the formula:
Return on Capital Employed = Earnings Before Interest and Tax (EBIT) ÷ (Total Assets - Current Liabilities)
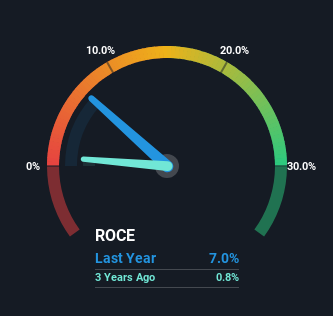
0.07 = UK£5.0m ÷ (UK£95m - UK£24m) (Based on the trailing twelve months to December 2023).
So, Ebiquity has an ROCE of 7.0%. Ultimately, that's a low return and it under-performs the Media industry average of 9.1%.
Check out our latest analysis for Ebiquity
Above you can see how the current ROCE for Ebiquity compares to its prior returns on capital, but there's only so much you can tell from the past. If you'd like to see what analysts are forecasting going forward, you should check out our free analyst report for Ebiquity .
What Can We Tell From Ebiquity's ROCE Trend?
There hasn't been much to report for Ebiquity's returns and its level of capital employed because both metrics have been steady for the past five years. This tells us the company isn't reinvesting in itself, so it's plausible that it's past the growth phase. So don't be surprised if Ebiquity doesn't end up being a multi-bagger in a few years time.
The Key Takeaway
In summary, Ebiquity isn't compounding its earnings but is generating stable returns on the same amount of capital employed. Since the stock has declined 21% over the last five years, investors may not be too optimistic on this trend improving either. On the whole, we aren't too inspired by the underlying trends and we think there may be better chances of finding a multi-bagger elsewhere.
Ebiquity does have some risks though, and we've spotted 1 warning sign for Ebiquity that you might be interested in.
If you want to search for solid companies with great earnings, check out this free list of companies with good balance sheets and impressive returns on equity.
Have feedback on this article? Concerned about the content? Get in touch with us directly. Alternatively, email editorial-team (at) simplywallst.com.
This article by Simply Wall St is general in nature. We provide commentary based on historical data and analyst forecasts only using an unbiased methodology and our articles are not intended to be financial advice. It does not constitute a recommendation to buy or sell any stock, and does not take account of your objectives, or your financial situation. We aim to bring you long-term focused analysis driven by fundamental data. Note that our analysis may not factor in the latest price-sensitive company announcements or qualitative material. Simply Wall St has no position in any stocks mentioned.
Have feedback on this article? Concerned about the content? Get in touch with us directly. Alternatively, email editorial-team@simplywallst.com
