
 Yahoo Finance
 Earnings are growing at Open Text (NASDAQ:OTEX) but shareholders still don't like its prospects
As an investor its worth striving to ensure your overall portfolio beats the market average. But if you try your hand at stock picking, your risk returning less than the market. We regret to report that long term Open Text Corporation (NASDAQ:OTEX) shareholders have had that experience, with the share price dropping 22% in three years, versus a market return of about 20%.
After losing 3.6% this past week, it's worth investigating the company's fundamentals to see what we can infer from past performance.
See our latest analysis for Open Text
There is no denying that markets are sometimes efficient, but prices do not always reflect underlying business performance. One way to examine how market sentiment has changed over time is to look at the interaction between a company's share price and its earnings per share (EPS).
During the unfortunate three years of share price decline, Open Text actually saw its earnings per share (EPS) improve by 13% per year. This is quite a puzzle, and suggests there might be something temporarily buoying the share price. Or else the company was over-hyped in the past, and so its growth has disappointed.
Since the change in EPS doesn't seem to correlate with the change in share price, it's worth taking a look at other metrics.
Revenue is actually up 17% over the three years, so the share price drop doesn't seem to hinge on revenue, either. It's probably worth investigating Open Text further; while we may be missing something on this analysis, there might also be an opportunity.
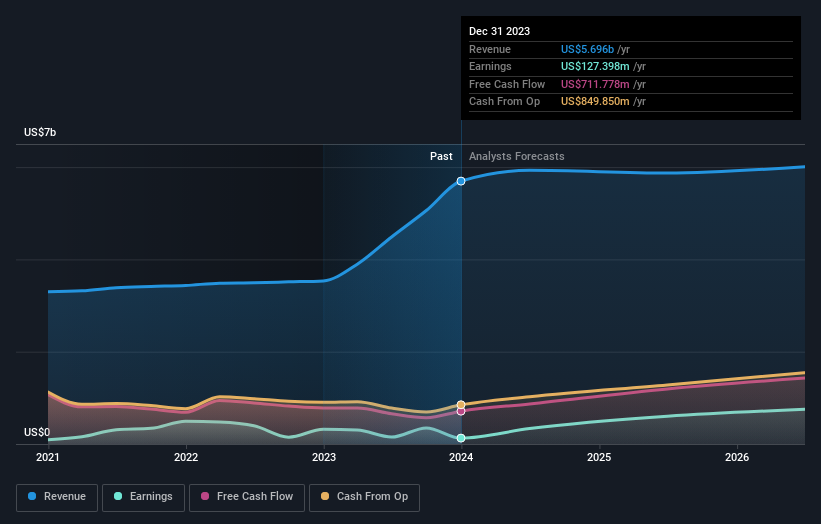
The graphic below depicts how earnings and revenue have changed over time (unveil the exact values by clicking on the image).
We like that insiders have been buying shares in the last twelve months. Having said that, most people consider earnings and revenue growth trends to be a more meaningful guide to the business. This free report showing analyst forecasts should help you form a view on Open Text
What About Dividends?
As well as measuring the share price return, investors should also consider the total shareholder return (TSR). Whereas the share price return only reflects the change in the share price, the TSR includes the value of dividends (assuming they were reinvested) and the benefit of any discounted capital raising or spin-off. It's fair to say that the TSR gives a more complete picture for stocks that pay a dividend. We note that for Open Text the TSR over the last 3 years was -17%, which is better than the share price return mentioned above. And there's no prize for guessing that the dividend payments largely explain the divergence!
A Different Perspective
Open Text shareholders gained a total return of 1.3% during the year. Unfortunately this falls short of the market return. On the bright side, the longer term returns (running at about 1.8% a year, over half a decade) look better. Maybe the share price is just taking a breather while the business executes on its growth strategy. While it is well worth considering the different impacts that market conditions can have on the share price, there are other factors that are even more important. Like risks, for instance. Every company has them, and we've spotted 5 warning signs for Open Text (of which 1 makes us a bit uncomfortable!) you should know about.
There are plenty of other companies that have insiders buying up shares. You probably do not want to miss this free list of growing companies that insiders are buying.
Please note, the market returns quoted in this article reflect the market weighted average returns of stocks that currently trade on American exchanges.
Have feedback on this article? Concerned about the content? Get in touch with us directly. Alternatively, email editorial-team (at) simplywallst.com.
This article by Simply Wall St is general in nature. We provide commentary based on historical data and analyst forecasts only using an unbiased methodology and our articles are not intended to be financial advice. It does not constitute a recommendation to buy or sell any stock, and does not take account of your objectives, or your financial situation. We aim to bring you long-term focused analysis driven by fundamental data. Note that our analysis may not factor in the latest price-sensitive company announcements or qualitative material. Simply Wall St has no position in any stocks mentioned.
