
 Yahoo Finance
 Earnings are growing at CarGurus (NASDAQ:CARG) but shareholders still don't like its prospects
Many investors define successful investing as beating the market average over the long term. But in any portfolio, there are likely to be some stocks that fall short of that benchmark. We regret to report that long term CarGurus, Inc. (NASDAQ:CARG) shareholders have had that experience, with the share price dropping 11% in three years, versus a market return of about 90%. The last month has also been disappointing, with the stock slipping a further 15%.
Given the past week has been tough on shareholders, let's investigate the fundamentals and see what we can learn.
Check out our latest analysis for CarGurus
While the efficient markets hypothesis continues to be taught by some, it has been proven that markets are over-reactive dynamic systems, and investors are not always rational. One flawed but reasonable way to assess how sentiment around a company has changed is to compare the earnings per share (EPS) with the share price.
Although the share price is down over three years, CarGurus actually managed to grow EPS by 19% per year in that time. This is quite a puzzle, and suggests there might be something temporarily buoying the share price. Or else the company was over-hyped in the past, and so its growth has disappointed.
It is a little bizarre to see the share price down, despite a strong improvement to earnings per share. Therefore, we should look at some other metrics to try to understand why the market is disappointed.
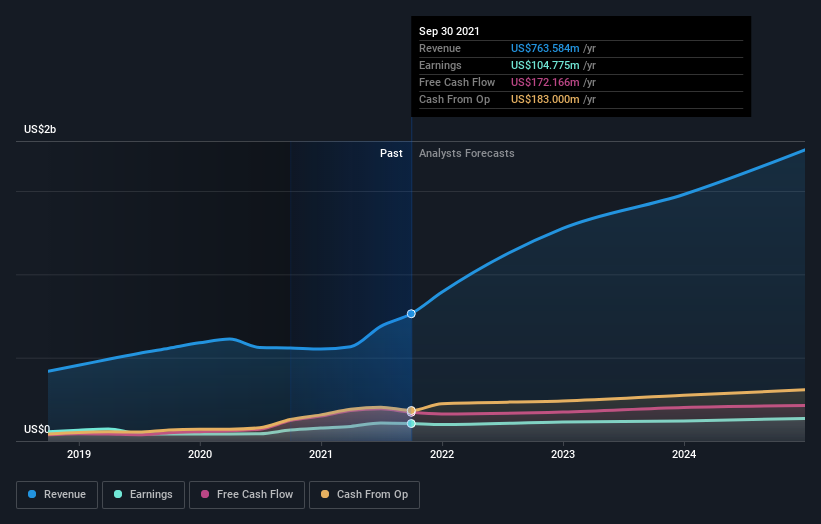
We note that, in three years, revenue has actually grown at a 14% annual rate, so that doesn't seem to be a reason to sell shares. It's probably worth investigating CarGurus further; while we may be missing something on this analysis, there might also be an opportunity.
The image below shows how earnings and revenue have tracked over time (if you click on the image you can see greater detail).
CarGurus is well known by investors, and plenty of clever analysts have tried to predict the future profit levels. So it makes a lot of sense to check out what analysts think CarGurus will earn in the future (free analyst consensus estimates)
A Different Perspective
Over the last year, CarGurus shareholders took a loss of 0.6%. In contrast the market gained about 18%. Of course the long term matters more than the short term, and even great stocks will sometimes have a poor year. Unfortunately, the longer term story isn't pretty, with investment losses running at 4% per year over three years. We would want clear information suggesting the company will grow, before taking the view that the share price will stabilize. I find it very interesting to look at share price over the long term as a proxy for business performance. But to truly gain insight, we need to consider other information, too. To that end, you should be aware of the 2 warning signs we've spotted with CarGurus .
But note: CarGurus may not be the best stock to buy. So take a peek at this free list of interesting companies with past earnings growth (and further growth forecast).
Please note, the market returns quoted in this article reflect the market weighted average returns of stocks that currently trade on US exchanges.
Have feedback on this article? Concerned about the content? Get in touch with us directly. Alternatively, email editorial-team (at) simplywallst.com.
This article by Simply Wall St is general in nature. We provide commentary based on historical data and analyst forecasts only using an unbiased methodology and our articles are not intended to be financial advice. It does not constitute a recommendation to buy or sell any stock, and does not take account of your objectives, or your financial situation. We aim to bring you long-term focused analysis driven by fundamental data. Note that our analysis may not factor in the latest price-sensitive company announcements or qualitative material. Simply Wall St has no position in any stocks mentioned.
