
 Yahoo Finance
 Earnings grew faster than the stellar 119% return delivered to Skyline Champion (NYSE:SKY) shareholders over the last year
Unless you borrow money to invest, the potential losses are limited. But if you pick the right stock, you can make a lot more than 100%. Take, for example Skyline Champion Corporation (NYSE:SKY). Its share price is already up an impressive 119% in the last twelve months. It's also good to see the share price up 11% over the last quarter. Also impressive, the stock is up 107% over three years, making long term shareholders happy, too.
While the stock has fallen 4.0% this week, it's worth focusing on the longer term and seeing if the stocks historical returns have been driven by the underlying fundamentals.
See our latest analysis for Skyline Champion
While the efficient markets hypothesis continues to be taught by some, it has been proven that markets are over-reactive dynamic systems, and investors are not always rational. One flawed but reasonable way to assess how sentiment around a company has changed is to compare the earnings per share (EPS) with the share price.
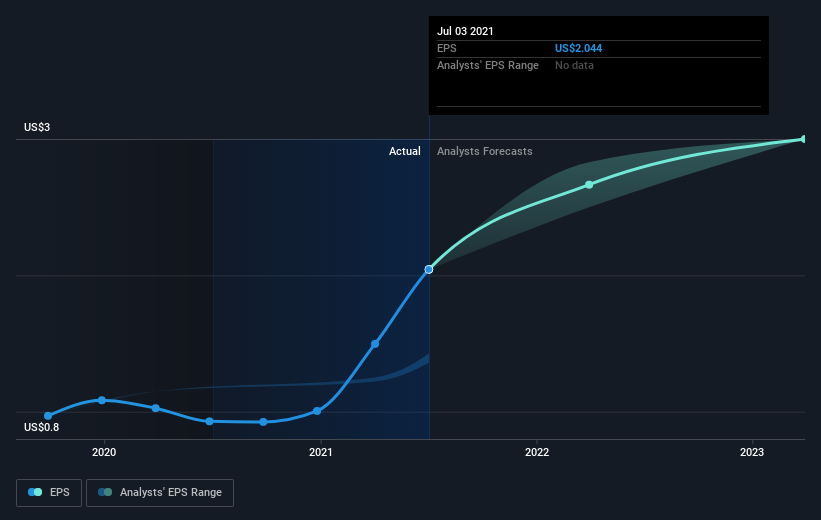
During the last year Skyline Champion grew its earnings per share (EPS) by 120%. The similarity between the EPS growth and the 119% share price gain really stands out. That suggests that the market sentiment around the company hasn't changed much over that time. It makes intuitive sense that the share price and EPS would grow at similar rates.
The image below shows how EPS has tracked over time (if you click on the image you can see greater detail).
It's probably worth noting that the CEO is paid less than the median at similar sized companies. But while CEO remuneration is always worth checking, the really important question is whether the company can grow earnings going forward. Dive deeper into the earnings by checking this interactive graph of Skyline Champion's earnings, revenue and cash flow.
A Different Perspective
Pleasingly, Skyline Champion's total shareholder return last year was 119%. That's better than the annualized TSR of 27% over the last three years. The improving returns to shareholders suggests the stock is becoming more popular with time. While it is well worth considering the different impacts that market conditions can have on the share price, there are other factors that are even more important. To that end, you should be aware of the 1 warning sign we've spotted with Skyline Champion .
We will like Skyline Champion better if we see some big insider buys. While we wait, check out this free list of growing companies with considerable, recent, insider buying.
Please note, the market returns quoted in this article reflect the market weighted average returns of stocks that currently trade on US exchanges.
This article by Simply Wall St is general in nature. We provide commentary based on historical data and analyst forecasts only using an unbiased methodology and our articles are not intended to be financial advice. It does not constitute a recommendation to buy or sell any stock, and does not take account of your objectives, or your financial situation. We aim to bring you long-term focused analysis driven by fundamental data. Note that our analysis may not factor in the latest price-sensitive company announcements or qualitative material. Simply Wall St has no position in any stocks mentioned.
Have feedback on this article? Concerned about the content? Get in touch with us directly. Alternatively, email editorial-team (at) simplywallst.com.
