
 Yahoo Finance
 E-mini S&P 500 Index (ES) Futures Technical Analysis – Longer-Term Bullish Over 2749.25, Bearish Under 2707.75
The broad-based stock index finished lower on Friday. Traders tried to trigger a breakout to the upside, but low volume ahead of the long-holiday week-end failed to attract enough buyers.
June E-mini S&P 500 Index futures settled at 2718.25, down 9.25 or -0.34%.
The index was also pressured by a steep drop in crude oil prices, which drove the energy sector lower. The financials sector was also under pressure as investors took profits in banking stocks in reaction to the dovish Fed minutes released earlier in the week.
Daily Swing Chart Technical Analysis
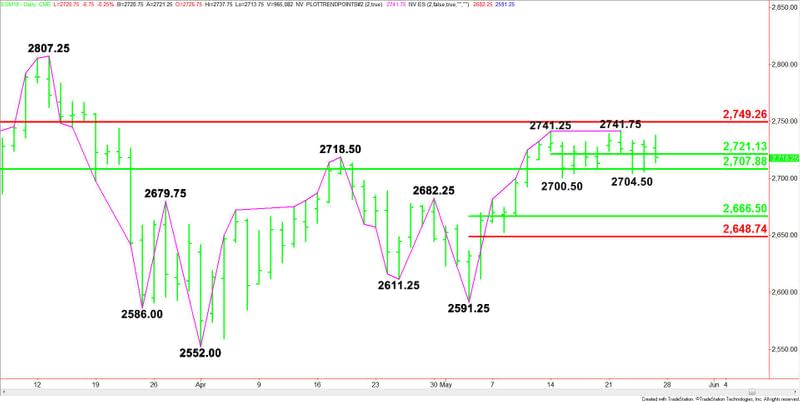
The main trend is up according to the daily swing chart. However, momentum is trending slightly lower. A trade through 2741.75 will signal a resumption of the uptrend and shift momentum to the upside.
The minor trend is down. It turned down last week on a move through the minor swing bottom at 2708.75. There wasn’t much of a follow-through break with the selling coming to an end at 2704.50.
A move through the bottoms at 2704.50 and 2700.50 will indicate the selling pressure is getting stronger. The latter is a trigger point for an acceleration to the downside.
The major area to watch is the retracement zone bounded by 2707.75 and 2749.25. The index is currently trading inside this zone. This zone is controlling the longer-term direction of the market.
Inside the major retracement zone is a short-term 50% level or pivot at 2721.25.
The main range is 2591.25 to 2741.75. If sellers can drive the index through 2700.50 then its retracement zone at 2666.50 to 2648.75 will become the primary downside target.
Daily Swing Chart Technical Forecast
Based on last week’s price action, the direction of the index is likely to be determined by trader reaction to the short-term pivot at 2721.25.
A sustained move under 2721.25 will indicate the presence of sellers. This could lead to a labored break with early targets at 2707.75, 2704.50 and 2700.50.
The trigger point for an acceleration to the downside is 2700.50. If sellers take out this level with conviction, the index could plunge into 2666.50 to 2648.75.
A sustained move over 2721.25 will signal the presence of buyers. If this move creates enough upside momentum, we could see a surge into 2741.75 then the major Fib level at 2749.25.
The daily chart indicates there is plenty of room to the upside over 2749.25.
This article was originally posted on FX Empire
More From FXEMPIRE:
Google Has Offered work to Ethereum’s Founder, Vitalik Buterin
Oil Price Fundamental Weekly Forecast – U.S. Drillers Add 15 New Oil Rigs
Natural Gas Price Fundamental Weekly Forecast – Traders Focusing On Next Week’s Neutral Forecast
GPU and ASIC – A Correlation and Barometer for Cryptocurrency Traders
