
 Yahoo Finance
 E-mini S&P 500 Index (ES) Futures Technical Analysis – In Position to Blast Through 2863.75 With 2889.00 Next Target
September E-mini S&P 500 Index futures settled higher on Monday and are now less than 1% from its record contract high. The price action indicates that concerns over trade wars and geopolitical events would not derail the bull market. Furthermore, with earnings season coming to a close, corporate deal making along with relatively low interest rates should continue to underpin prices.
Weekly Technical Analysis
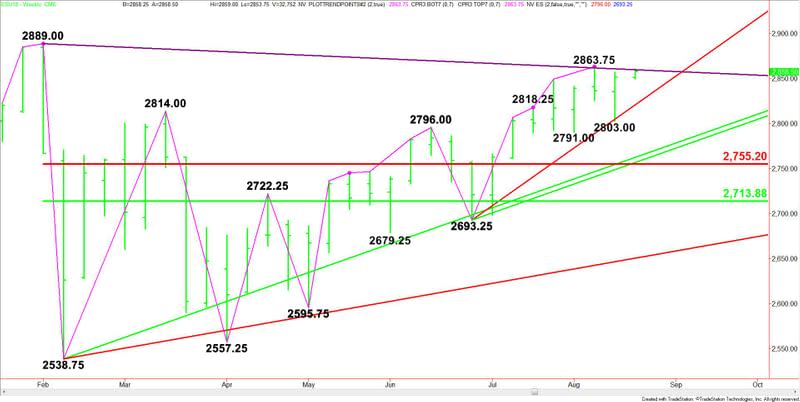
The main trend is up according to the weekly swing chart. A trade through 2863.75 will negate a closing price reversal top and signal the resumption of the uptrend. The next target is 2889.00.
The main trend is in no danger of turning lower, but the minor trend will change to down on a trade through 2803.00. It will be reaffirmed on a move through the minor bottom at 2791.00.
The main range is 2889.00 to 2538.75. Its retracement zone at 2755.25 to 2713.75 is support. Holding above this zone is helping to give the index a strong upside bias.
Weekly Technical Forecast
Based on Monday’s price action, the direction of the September E-mini S&P 500 Index this week is likely to be determined by trader reaction to the long-term downtrending Gann angle at 2860.00.
A sustained move over 2860.00 will indicate the presence of buyers. This could lead to a quick test of the closing price reversal top at 2863.75. This price is a potential trigger point for a surge into the contract high at 2889.00.
The inability to overcome 2860.00 or a sustained move under this level will signal the presence of sellers. If this move gains enough downside momentum, then look for a potential break into the uptrending Gann angle at 2821.25.
The angle at 2821.25 is important because it has been guiding the index higher for 8 weeks. Last week, it stopped the selling at 2803.00.
If 2821.25 fails then look for sellers to go after the minor bottoms at 2803.00 and 2791. Taking out this minor bottoms will shift momentum to the downside.
For longer-term players, look for the bullish tone to continue on a sustained move over 2860.00. Look for a bearish tone to develop on a sustained move under 2821.25.
This article was originally posted on FX Empire
